Long-Term NAEP Scores for 13-Year-Olds Drop for First Time Since Testing Began in 1970s — ‘A Matter for National Concern,’ Experts Say

;)
Untangle Your Mind!
Sign up for our free newsletter and start your day with in-depth reporting on the latest topics in education.
Get stories like this delivered straight to your inbox. Sign up for The 74 Newsletter
Thirteen-year-olds saw unprecedented declines in both reading and math between 2012 and 2020, according to scores released this morning from the National Assessment of Educational Progress (NAEP). Consistent with several years of previous data, the results point to a clear and widening cleavage between America’s highest- and lowest-performing students and raise urgent questions about how to reverse prolonged academic stagnation.
The scores offer more discouraging evidence from NAEP, often referred to as “the Nation’s Report Card.” Various iterations of the exam, each tracking different subjects and age groups over several years, have now shown flat or falling numbers.
The latest release comes from NAEP’s 2020 assessment of long-term trends, which was administered by the National Center for Education Statistics to nine- and 13-year-olds before COVID-19 first shuttered schools last spring. In a Wednesday media call, NCES Commissioner Peggy Carr told reporters that 13-year-olds had never before seen declines on the assessment, and the results were so startling that she had her staff double-check the results.
“I asked them to go back and check because I wanted to be sure,” Carr recalled. “I’ve been reporting these results for…decades, and I’ve never reported a decline like this.”
The eight-year gap between 2020’s exam and its predecessor, in 2012, is the longest interval that has ever passed between successive rounds of the long-term trend assessment; a round that was originally scheduled for 2016 was nixed for budgetary reasons. Given the length of time between exams and the general trend of increasing scores over multiple decades, observers could have expected to see at least some upward movement.
Instead, both reading and math results for nine-year-olds have made no headway; scores were flat for every ethnic and gender subgroup of younger children — with the exception of nine-year-old girls, who scored five points worse on math than they had in 2012. Their dip in performance produced a gender gap for the age group that did not exist on the test’s last iteration.
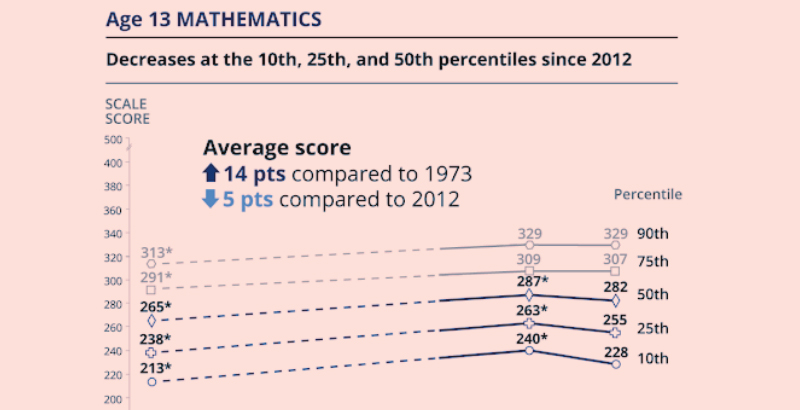
More ominous were the results for 13-year-olds, who experienced statistically significant drops of three and five points in reading and math, respectively. Compared with math performance in 2012, boys overall lost five points, and girls overall lost six points. Black students dropped eight points and Hispanic students four points; both decreases widened their score gap with white students, whose scores were statistically unchanged from 2012.
In keeping with previous NAEP releases, the scores also showed significant drops in performance among low-performing test-takers. Most disturbing: Declines among 13-year-olds scoring at the 10th percentile of reading mean that the group’s literacy performance is not significantly improved compared with 1971, when the test was first administered. In all other age/subject configurations, students placing at all levels of the achievement spectrum have gained ground over the last half-century.
“It’s really a matter for national concern, this high percentage of students who are not reaching even what I think we’d consider the lowest levels of proficiency,” said George Bohrnstedt, a senior vice president and institute fellow at the American Institutes for Research.
Tom Loveless, an education researcher and former director of the Brookings Institution’s Brown Center on Education Policy, said that the reversals in math performance were particularly disappointing because they defied NAEP’s recent trends. For roughly the last three decades, even as politicians and education policy mavens have emphasized literacy instruction, comparatively rapid growth in math scores have made that subject “the star of the show,” Loveless said.
“Now it almost appears as if those gains are now unwinding, they’re going away. And I don’t think anyone has been able to identify why that’s happening.”
Bohrnstedt who has followed NAEP for much of his career, said the declines in 13-year-old math performance was notable for another reason: The long-term trends assessment, which been administered by NCES for a half-century, differs substantively from from the content found on other versions of the test. Reflecting the way math was taught in the 1970s, the assessment features more naked math problems and less complex problem-solving than the so-called “main NAEP,” which is administered to fourth- and eighth-graders every two years.
“For the most part, it’s a more basic kind of math than is being taught today, so it’s disappointing to see that we’re still seeing this poor performance by large percentages of our children,” Bohrnstedt said.
Overall, Loveless said, the combination of flat scores on the biennial “main NAEP” and significant declines on this version of the test indicates that American math instruction changed direction over the last decade in a way that may have stymied learning. While hesitating to blame the Common Core curricular reforms that spread during the Obama administration — he recently wrote a book on the oft-maligned learning standards — Loveless called for further research to investigate possible causes.
“To me, it suggests that beginning a decade or so ago, something went wrong with how we teach math to younger students,” he said. “My own hypothesis is that an emphasis on conceptual understanding has gone too far, that without computational skills to anchor math concepts, students get lost.”
Michael Petrilli, head of the reform-oriented Thomas B. Fordham Institute and a defender of the Common Core standards, said that the results could reflect an alternative theory: That the social and financial overhang of the Great Recession profoundly disrupted skills formation for children who are now reaching their teen years.
“Assuming that Common Core wasn’t implemented until about 2013, the 13-year-olds wouldn’t have been exposed to it until about second grade,” Petrilli wrote in an email. “The nine-year-olds, on the other hand, got it from kindergarten. So why are the 9 year olds holding steady?”
‘Very Discouraging’
Perhaps the most striking revelation from the release is the continued divergence in scores between students at the top and bottom of the performance distribution — a phenomenon that Commissioner Carr called “well-established” during Wednesday’s media session.
Throughout all four age and subject configurations, when average scores for most students were stagnant, scores for the lowest-performing students were down; when scores for most students were down, scores for the lowest-performing plummeted.
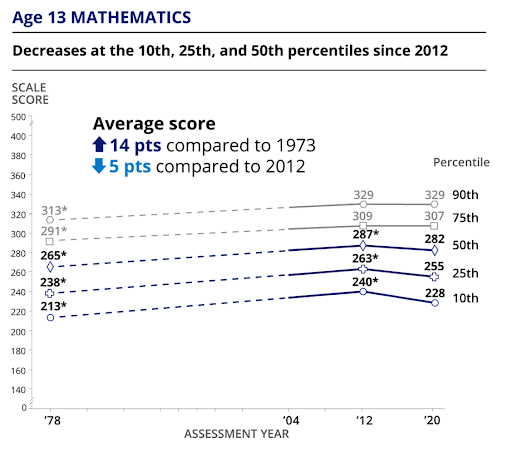
In nine-year-old reading, where average scores remained unchanged from 2012 — and scores for the top-performing students ticked up a point — those for students scoring at the 10th percentile fell seven points. The same students lost six points in math, while 13-year-olds scoring at the 10th percentile dropped five points in reading and an astonishing 12 points in math.
Even comparatively low-performers at higher levels lost ground in some respects. Nine-year-olds marked at the 25th percentile dropped four points in math, while 13-year-olds at the 25th and 50th percentiles lost eight and five points, respectively, in the subject.
“It’s very discouraging to see this steep drop at the 10th percentile in both reading and mathematics, but especially in mathematics,” Bohrnstedt concluded. “It also confirms what we’ve seen with respect to the high percentage of kids performing at the ‘below basic’ level in the main NAEP.”
The long-term assessment is a crucial piece of data for another reason: It was administered to students between October 2019 and March 2020, making it a final snapshot of academic trends before the emergence of COVID-19. Loveless said he hoped future analyses of how kids learned during and after the greatest disaster in K-12 history wouldn’t overlook the “deeper,” persistent stagnation that preceded it.
“These scores represent the last valid, national assessment of student achievement pre-pandemic. For that reason, they will take on historical significance as a baseline measure when future analysts attempt to gauge the impact of the pandemic on student learning.”
Get stories like these delivered straight to your inbox. Sign up for The 74 Newsletter