Most States Are Missing Key Student Data From Their Report Cards. 3 Parent Empowerment Groups Have Advice for Making Them Better

;)
Untangle Your Mind!
Sign up for our free newsletter and start your day with in-depth reporting on the latest topics in education.
Who should own education data?
If you ask the Data Quality Campaign’s Brennan McMahon Parton, it’s the community — students and their families have the right to know how their schools are doing for all students, she says. But some states are making that pretty difficult.
That’s why her organization partnered with two other parent empowerment groups to create a resource outlining advice and best practices for creating community-friendly state report cards. The Campaign worked with the National PTA and Learning Heroes to release “Disaggregated Data: Not Just a Box Checking Exercise” in late October.
An analysis of state report cards earlier this year by the Data Quality Campaign, a nonprofit focused on improving education data and making the information more accessible, found that most states were not breaking out data for all of the student groups as required by federal law.
The analysis found that just 10 states separated out data for all of the required student groups in their state report cards: Delaware, Kentucky, Maine, Nebraska, New Jersey, New York, North Dakota, Rhode Island, South Dakota and Wyoming. The others — plus Washington, D.C., and Puerto Rico — were missing one or more student groups in their reports. Florida and Massachusetts have released new report cards since the analysis that show data for all groups from the 2018-19 school year. Some other states may have also updated their report cards since Data Quality Campaign checked in January. The law’s flexibility and waivers make it difficult to track exactly which states are meeting the requirements.
“People deserve this data,” Parton told The 74. “It’s not the state’s data. It’s our data — it’s that community’s data. They deserve to have it in a way that’s easy to find, use and understand.”
Having access to state- and school-level data helps parents “do the math” about academic performance, Parton said. Parents are “pretty adept” at figuring out how well their students are doing in school by looking at the individual report cards their kids bring home and how the school is performing overall, she added. Clearer, easier-to-navigate school, district and state report cards help parents answer the bigger questions they have about their children’s schools and district, Parton said.
“Families and communities need a way to piece together that picture and understand, how are the adults, how are the leaders, how are the elected school board members in my school or district really supporting my student? Do I think they’re getting the best possible suite of opportunities?” Parton said. “A [state] report card is really the entry point for that conversation.”
Under the Every Student Succeeds Act, the federal education law passed in 2015, states must break out academic performance data for nine categories: gender, race and ethnicity, students with disabilities, students from low-income families, students learning English, students in foster care, students experiencing homelessness, students from military families, and students from migrant families.
Gathering and verifying all the numbers takes time, but states are working to make their data public, said Kirsten Carr, senior program director for student expectations at the Council of Chief State School Officers.
“States are deeply committed to getting all of the information out there as quickly as they can [while] making sure that it’s accurate,” she told The 74, noting that in some cases, education departments have to work across agencies to get the data they need.
State leaders are also working to make the information “meaningful” for parents and stakeholders, she said.
Several of the required groups, such as students experiencing homelessness and black and Latino students, have been historically underserved by schools and often land on the wrong side of achievement gaps.
Some of the state report cards that already display all of the groups may still lack key data.
Although New York is reporting statewide data for all of the groups, recent reporting from The 74 revealed that New York City, the nation’s largest school district, with more than 1.1 million students, is not yet reporting broken-out performance data for students in foster care. Proficiency rates for military-connected students and migrant students in New York City schools are also missing. The scores on the state report card reflect only the districts that have submitted detailed data to the state, meaning it is incomplete.
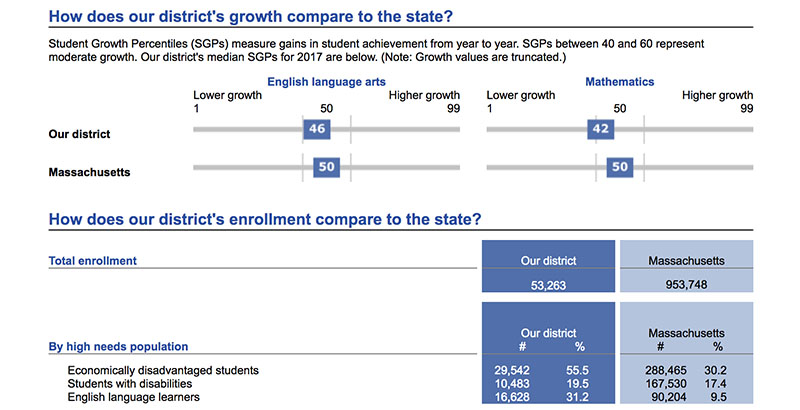
Having access to the data broken out for these cohorts can help families see how well schools are serving them. For example, the latest report card for New York City schools shows that 46 percent of students in third through eighth grade were proficient in math on the state test. But when the data are broken down by race, a gap appears: 67 percent of white students were proficient, compared with 28 percent of their black peers and 33 percent of Hispanic and Latino students.
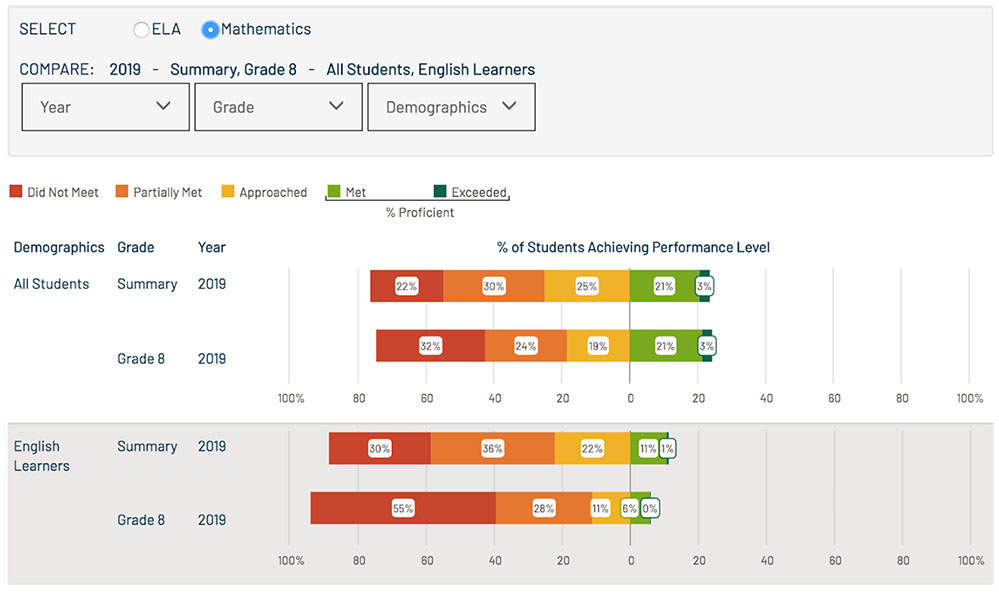
In another example, the Chicago Public Schools district report card shows that 24 percent of all students were proficient on the state math test, but a closer look reveals that just 6 percent of English language learners passed the test in eighth grade.
The reporting requirements are meant to push states toward accountability and transparency, but there are no hard deadlines or consequences at this time. Parton said she and her team are “flummoxed” about why so many data points are missing from the report cards, especially because some of the missing student group requirements — such as reporting scores by gender — were also required under No Child Left Behind, the prior K-12 education law.
The organizations urge state leaders to do two things to improve their report cards: Make the data easier to find and help families understand the information. The second step has two parts:
1. Put the data in context: For example, show school data side by side with another school or with the overall state numbers for easy comparison or include a simple sentence that gives context.
2. Explain what the numbers mean and why they’re there: “Without context, the data appears to make a statement about students’ abilities when really it is a statement about how the school is serving its students,” the authors write. In other words, report cards should explain that breaking out student data is a judgment of the adults in schools rather than the kids.
The report also notes that report cards should be at an eighth-grade reading level to be accessible and to ensure accurate translations. An analysis by DQC found that the average reading level for state report cards was 14th grade, equivalent to “some college.”
Just adding a sentence or two about what the numbers mean and why they matter can make a big difference for parents, said Bibb Hubbard, founder and president of Learning Heroes, a nonprofit focused on improving parent access to education data. Additionally, she said, state report cards should prioritize the data that parents want. Parents are more interested in school performance than student attendance rates, for example, according to Learning Heroes research.
“Start with what they care most about because then you’ll get their attention,” she said. “If you start with the stuff that they don’t care about, you’ll lose them right away.”
Disclosure: Bill & Melinda Gates Foundation, Charles and Lynn Schusterman Family Foundation, Bloomberg Philanthropies and Carnegie Corporation of New York provide financial support to Learning Heroes and The 74. Bill & Melinda Gates Foundation, Carnegie Corporation of New York and Chan Zuckerberg Initiative provide financial support to Data Quality Campaign and The 74.
Get stories like these delivered straight to your inbox. Sign up for The 74 Newsletter