Analysis: New DQC Review Shows Most State School Report Cards Getting Easier to Access — but Too Few Go Far Enough in Giving Parents the Full Picture

;)
Untangle Your Mind!
Sign up for our free newsletter and start your day with in-depth reporting on the latest topics in education.
Parents and communities deserve clear, accurate information about how their schools are serving students, and state report cards are a crucial vehicle for getting that information out. So it’s exciting that states are commiting to improving their report cards and making real progress, as demonstrated in Show Me the Data, the Data Quality Campaign’s third analysis of state report cards. Still, there’s much more for states to do to make sure these resources are easy for people to understand and use.
Busy parents can’t spend hours on a scavenger hunt to find information about their children’s schools — but DQC can. Our research team spent almost an hour per state reviewing 114 data elements for each of the 50 states, the District of Columbia and Puerto Rico. They looked at one elementary and one high school report card in each of these states in order to fully understand the range of information available to parents and the public.
What we found was encouraging but far from excellent.
The good news is that most state report cards are easier to access than ever. We found that 42 states’ report cards come up within the top three results of a simple internet search. Plus, states are focusing on how people actually access and use these resources. Many have taken vital steps such as creating mobile-friendly versions that are formatted for cell phones and tablets (31 have done so), providing a PDF version to easily download and print (30), and offering downloadable data for anyone who wants to dig deeper into the numbers (35).
But despite this great progress, states must do more to make the data easy to understand. The majority of report cards, for example, are written at a college reading level. Most parents and community members aren’t policy wonks or data scientists — people need plain information that helps them take action and make decisions about their kids’ education.
Most concerning, many state report cards still do an inadequate job of reporting how well their schools serve different groups of students. A whopping 42 states do not include disaggregated achievement data for at least one federally required subgroup. For example, 21 states don’t disaggregate data by gender — a federal requirement since 2001. Without specific information on students divided by gender, race/ethnicity and other important characteristics, families and communities have an incomplete picture of how all students are being served by their local schools. If people can’t find that information on publicly available state report cards, they won’t be able to address the educational inequities in their schools and states.
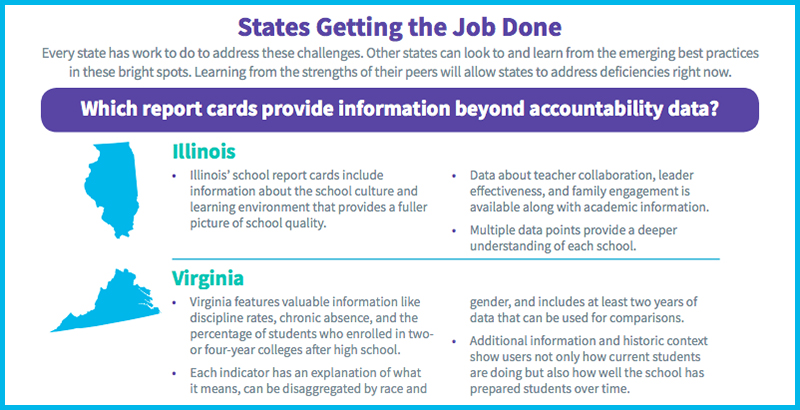
On the bright side, several states are innovating with their report card designs to ensure that critical information is in an easy-to-understand format. Mississippi is one example: The state completely revamped its report card last year to be more navigable and comprehensive, including simple visuals that help put data in context. Rhode Island’s new report card design provides more and better data — including per-pupil expenditures, one of only five states to do so before it becomes federally required. And Idaho’s new report card features translations as well as performance data for new subgroups, including military-connected students, students in foster care and students experiencing homelessness. While none of these report cards is perfect, these three states prove that progress is possible from year to year.
No state is doing everything it can — yet — to ensure its report cards are providing families and the public with the information they need for a full picture of student learning in their communities. But the strides many states have taken this year show a real commitment to service and transparency.
This is no time to slow down. States should focus on improving design to make their report cards more readable and understandable, incorporating more and better data to provide context for student success, and considering different approaches to redesign, whether with external consultants or by tapping in-house expertise. State leaders at every level can reflect on how their report cards are working and reinvest in effective practices. When families and communities have the right information to make decisions, all students are set up for success.
Jennifer Bell-Ellwanger is president and CEO of the Data Quality Campaign. More on DQC’s analysis, including the full report and bright spots in states, is available on DQC’s Show Me the Data page.
Get stories like these delivered straight to your inbox. Sign up for The 74 Newsletter