Interactive: See How Student Achievement Gaps Are Growing in Your State
Aldeman: The easing of No Child Left Behind in 2012 set off a decline that is still being felt. Maybe it's time to bring back accountability
By Chad Aldeman | February 26, 2024
Achievement scores fell in the wake of COVID-19. That story has been well told …
But what’s less well-known is that achievement scores had already suffered a lost decade before the pandemic hit.
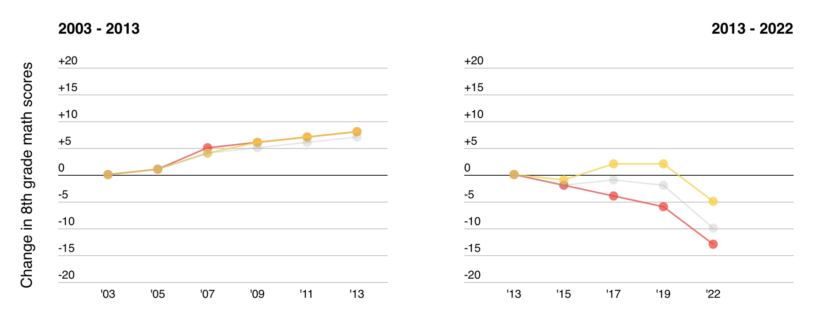
Across grade levels, average scores peaked around 2013 and have been falling since then.
Worse, the averages are masking a growing achievement gap between the highest and lowest performers.
That gap was growing pre-pandemic and has only widened.
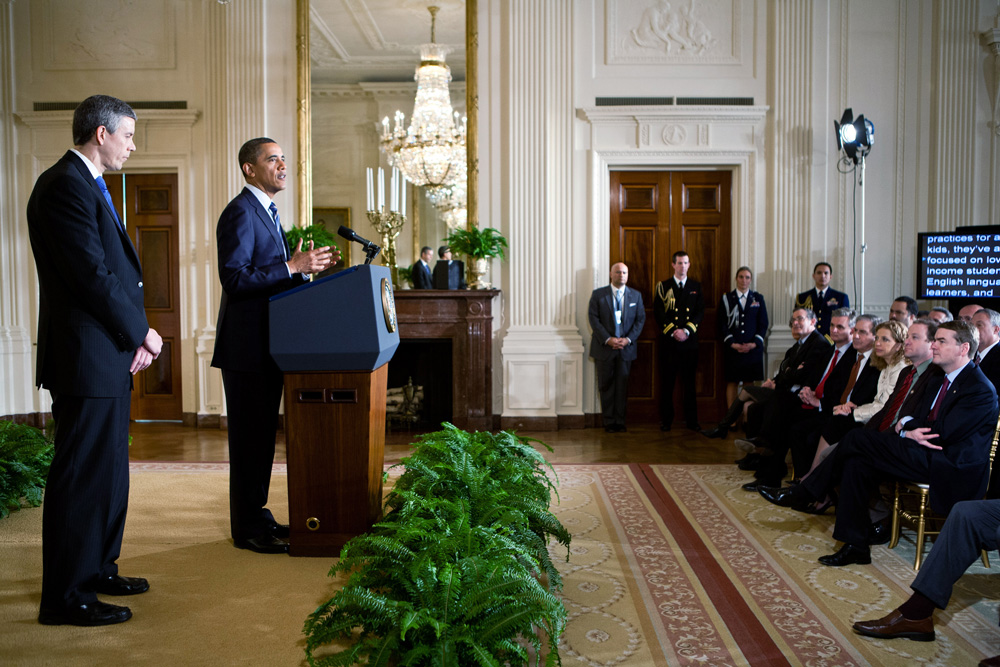
On Feb. 9, 2012, then-President Barack Obama invited chief state school officers, governors, superintendents and members of Congress to the East Room of the White House.
Before the assembled crowd, Obama announced that he was granting states waivers from the federal No Child Left Behind Act (full disclosure: I worked on this project at the U.S. Department of Education and was in the audience that day). In exchange for a suite of reforms related to standards, assessments and teacher evaluations, states would be freed from NCLB’s most onerous accountability provisions.
With the stroke of the pen, Obama waved away the notion that all schools needed to make “adequate yearly progress” for all students and for individual student groups. Instead of interventions for all children in low-performing schools, states could choose how many schools to identify for improvement and what happened there.
NCLB’s accountability pressures had been instrumental in a decade-plus of small but significant gains. That progress was perhaps smaller than policymakers and educators might have preferred, but it was broadly shared. In eighth-grade math, for example, the lowest and highest performers both improved about 8 points — close to a year’s worth of progress — on NAEP, the Nation’s Report Card, from 2003 to 2013.
Obama’s relaxing of school and district accountability pressures helped set off a decline in student performance across the country. By the time Congress passed, and Obama signed, the Every Student Succeeds Act in 2015, achievement scores had already begun to fall.
Not only that, but the declines were uneven. From 2013 to 2019, scores for the lowest-performing 10% of students fell 7 points, versus a gain of 3 points for students at the higher end. The response to COVID-19 would eventually widen the gap even further, but it had been growing well before anyone had ever heard of the coronavirus.
Today, achievement gaps are growing across subjects and all across the country. Overall, 49 of 50 states, the District of Columbia and 17 out of 20 of the large cities that participated in NAEP saw a widening of their achievement gap over the last decade. To help visualize how these disparities are changing within individual states and cities, I worked with Eamonn Fitzmaurice, The 74’s art and technology director, to create the interactive tool below. Click to find the results for your state or city.
NAEP Math Scores
Select a state or city below for detailed information
- All Students
- Higher Performing Students
- Lower Performing Students
We chose to focus on eighth-grade math for this exercise because early math skills are linked to long-term life outcomes. However, similar achievement trends are evident in other grades and subjects as well. For example, the American Enterprise Institute’s Nat Malkus has documented the same growing achievement gaps in reading, history and civics.
What’s behind the decline?
A primary factor is the softening of NCLB. The law may not have been especially popular, but at least part of the gains from that era were attributable to its school and district accountability systems. When researchers evaluated the effects of NCLB, they found the law led to noticeable gains in math, especially for the lowest-performing students. When schools felt pressure from state accountability systems, they increased their academic standards and boosted achievement in ways that had long-term benefits for students.
New York City provides an illustrative example of what happens when accountability pressure goes away. Under then-Mayor Michael Bloomberg, the city instituted an A-F school rating system in 2007. Research found that the system significantly boosted student achievement, particularly in F-rated schools. But in 2014, the city abandoned that grading system and the previous gains went away.
New York City’s NAEP scores show similar trends. All students made large gains from 2003 to 2013, but the lines diverge after that. While the city’s higher-performing students continued to improve, the scores of lower performers fell 10 points over the last decade.
There are plenty of other potential theories explaining these trends beyond accountability, but they don’t fully align with the timing, scope or magnitude of the declines. In 2019, the Fordham Institute’s Mike Petrilli looked into the “lost decade” and suggested it could be due to economic factors, screens and other technology or a shift away from basic skills. Others, including Diane Ravitch and the Pioneer Institute’s Theodor Rebarber, blamed the shift to the Common Core state standards, which was happening about the same time.
Economic factors could certainly play a role. Petrilli is right to note that recessions and periods of rising unemployment are bad for kids, especially the most disadvantaged ones. Plus, the Great Recession of 2007-09 did set off a wave of austerity in some states. Given what we know about how education spending boosts student performance, particularly among low-income students, this feels plausible.
However, the timing isn’t right. The economic recovery throughout the 2010s and rise in education spending should have augured well for student performance. Yet, the opposite was happening as achievement fell and gaps grew.
The economic argument also doesn’t explain the scope of the declines. While achievement was falling, 47 of 50 states were increasing their inflation-adjusted per-pupil spending. Washington state, for example, increased its spending by 38% over this time period, but its achievement scores fell more than the national average and its achievement gap widened. It’s possible the losses would have been worse if not for the new money, but something else had to be driving the decline.
The same flaws apply to arguments around the Common Core. If disruptions associated with the shift to the Common Core were the cause, the scores should have rebounded over time. But they didn’t.
It’s also possible that the Common Core pushed schools to cover different topics in a different order, but that doesn’t explain why achievement gaps grew even in non-Common Core states such as Alaska, Nebraska, Texas, and Virginia, or why the same patterns appear in civics and history, which the Common Core did not address.
What about technology? Screens have become more pervasive at home and in schools, and kids are reading for fun less often than they used to. Psychologist Jean Twenge has pinpointed 2012 — the first year when more than half of Americans owned a smartphone — as the beginning of a noticeable decrease in teen mental health.
That timing lines up with the achievement declines, but it’s not quite clear why the technology problem would hit children in the U.S. harder than in other places. And yet, achievement gaps in math and science for both fourth and eighth graders widened faster here in America than in any other country (and they were already quite wide here). We have a unique achievement gap problem.
These trends are sobering, but there is one hopeful lesson here: Holding school systems accountable for their lowest-performing students was working — until policymakers decided the pressure wasn’t worth it. It may be time once again to ask schools to focus on the academic achievement of their lowest-performing students.
Get stories like these delivered straight to your inbox. Sign up for The 74 Newsletter
Chad Aldeman is a regular columnist for The 74. He writes about school finance, state assessments and accountability, and the teacher labor market. He is also the founder of Read Not Guess, a program to help parents teach their children to read
@ChadAldeman