Which School Districts Do the Best Job of Teaching Math?
Aldeman: In some 600 districts, 8th graders significantly outperform expectations. See which school systems in your state get exceptional results.
By Chad Aldeman | December 4, 2024
If asked to name the school districts that do the best job of teaching math, people might think of wealthy enclaves like Scarsdale, New York; tech hubs in California’s Silicon Valley; or college towns like Ann Arbor, Michigan.
Few of them would think of Neshoba County in Mississippi.
But Neshoba County schools are doing something that those other places are not: They serve a high-poverty community, yet their students’ math scores are competitive with those in wealthier areas.
Back in September, I worked with Eamonn Fitzmaurice, The 74’s art and technology director, to find districts around the country that were doing the best job of helping kids learn to read proficiently by third grade. Today, we’re taking the same approach to eighth-grade math. We calculated each district’s expected math proficiency rate, based on its local poverty level, and compared that to its actual scores. This methodology helped us identify districts that are beating the odds in math.
Select from the menu below to find the high fliers in your state.
INTERACTIVE
Eighth Grade Math Proficiency

At the national level, eighth-grade math scores peaked in 2013, were slipping leading up to the pandemic and then fell dramatically. The declines were particularly large for students who were already among the lowest-performing.
Mississippi weathered these declines better than most states. As a result, the Urban Institute found that Mississippi climbed the state rankings in both math and reading over the last decade. After controlling for student demographics, Mississippi was ahead of 40 other states by 2019, and its scores rebounded quicker than other states’ after COVID.
Neshoba County helped lead that rise. According to data from the Educational Opportunity Project at Stanford University, Neshoba’s students went from scoring more than half of a grade level below the national average in 2016 to nearly 1.5 grade levels above the national average last year. Their students made gains even in the midst of the COVID-19 pandemic.
When we started looking for districts that were beating the odds, we aimed to find and celebrate districts like Neshoba. We ultimately identified nearly 600 districts that are getting exceptional results in math, which we defined as significantly outscoring their expected eighth-grade proficiency rate.
Some districts are showing strong performance in both third-grade reading and eighth-grade math. For example, in the reading project we highlighted Steubenville City, Ohio, at the top of our rankings. Despite its relatively high poverty, 81% of its eighth graders score as proficient in math, which puts it on par with districts that have many fewer disadvantaged students.
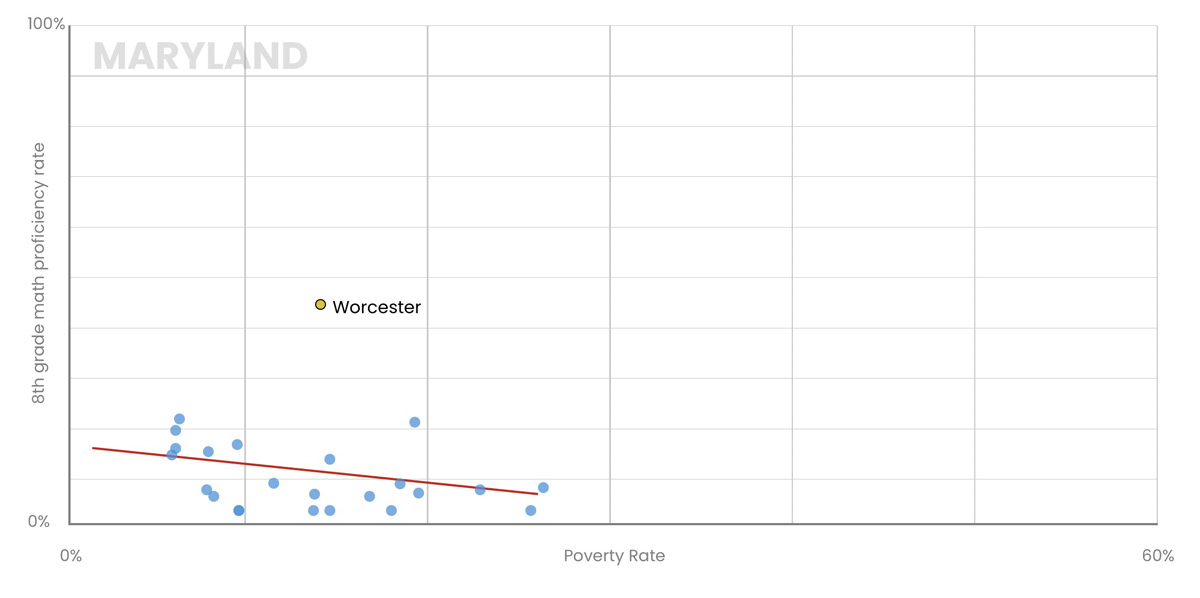
States set their proficiency cut points at different levels, and Maryland has one of the highest bars. And yet, students in Worcester, a community that is neither high- nor low-poverty, stands out for having eighth-grade math proficiency rates 20 points higher than kids in any other district in the state.
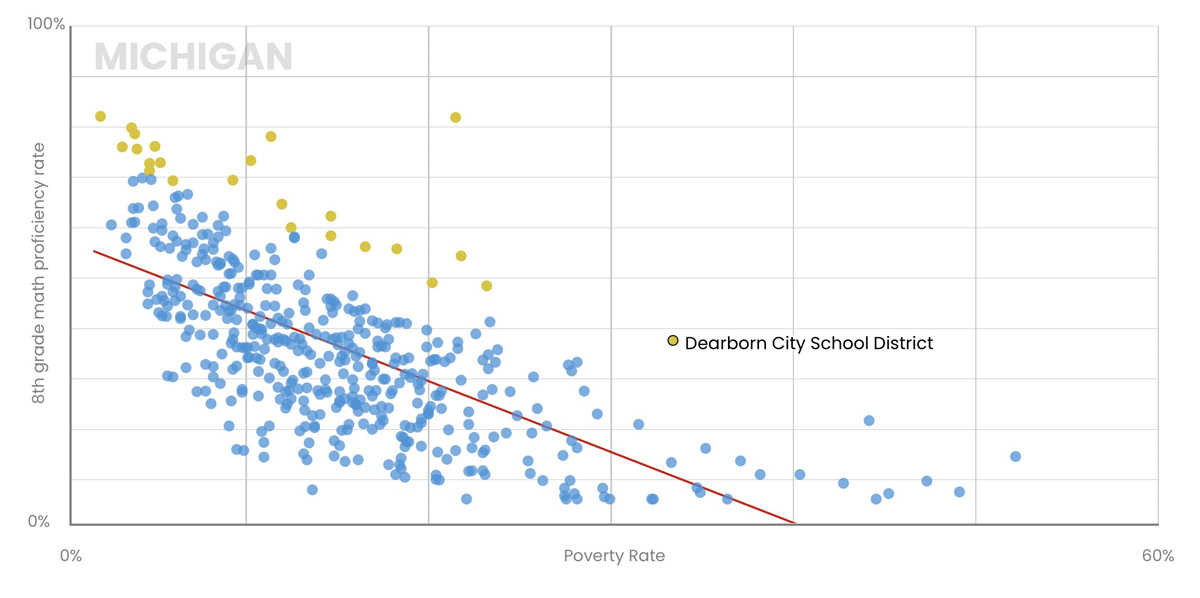
In Michigan, Dearborn City is getting the same results as other districts with much lower poverty rates.
Other strong outliers include places like Genoa Central in Arkansas, Lake Washington in Washington state, the Fossil School District in Oregon and the Murray Independent district in Kentucky.
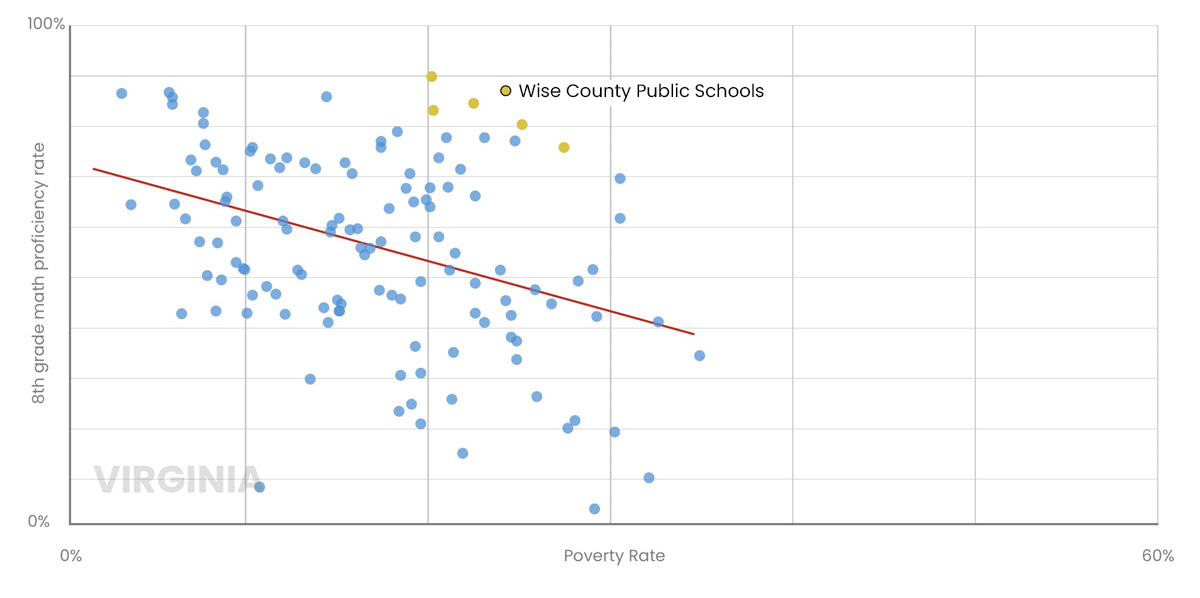
In northern Virginia, where I live, people often say they move here for the schools. But if they were really looking for the best school system in the state, they would move to Wise County, on the Kentucky border. Wise County has much higher poverty rates than the more well-known D.C. suburbs, yet it topped our Virginia rankings in both reading and math.
Looking at the scores this way helps identify the places with great school systems, where learning gains are driven by what students learn in the classroom. This is especially true in math, because unlike reading proficiency — which is closely tied to language skills and background knowledge that children acquire at home — math scores are more directly linked to school-based instruction.
This gets at the heart of the issue at hand. Parents and policymakers should not be content with answering the simple question of, “Where do students do the best?” Wealthy communities are likely to look good by that standard, just by the nature of the students they serve.
Instead, policymakers should be trying to find schools and districts that help all students learn, regardless of their income levels. Poverty is certainly predictive of school performance, but it need not be determinative.
Note: For more details about the data sources and methodology for this project, see our earlier reading analysis.
Get stories like these delivered straight to your inbox. Sign up for The 74 Newsletter
Chad Aldeman is a regular columnist for The 74. He writes about school finance, state assessments and accountability, and the teacher labor market. He is also the founder of Read Not Guess, a program to help parents teach their children to read
@ChadAldeman