As Calls for Integration Mount, Analysis Finds 41% of New York City Schools Don’t Represent Their District’s Student Demographics

;)
Untangle Your Mind!
Sign up for our free newsletter and start your day with in-depth reporting on the latest topics in education.
As New York City’s school integration efforts become increasingly localized, a nonprofit has released a new data analysis that illustrates how much the student makeup of individual schools can diverge from their districts as a whole.
A deep-dive compilation of 2018-19 education department data by Citizens’ Committee for Children of New York found that 41 percent of some 1,800 city public schools do not have racial and ethnic compositions that reflect their local districts’ overall student populations. The advocacy group observed that disparities in student representation by race/ethnicity at individual schools occur even when the local district — NYC’s school system has 32 of them across the five boroughs — has a diverse student enrollment.
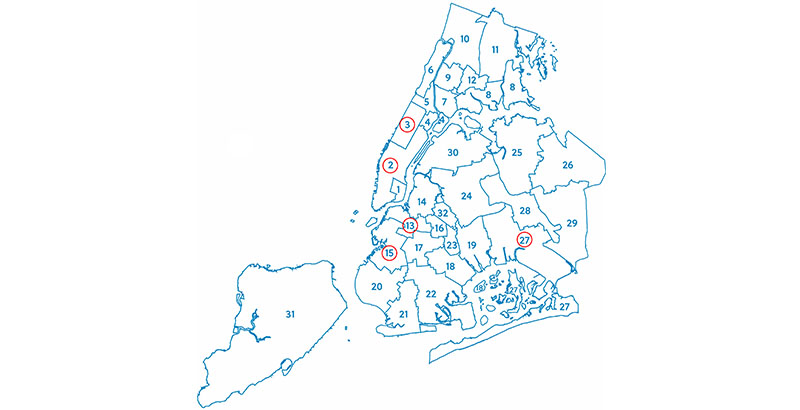
The starkest divides are seen in District 3 on the Upper West Side and District 2, which includes the Upper East Side; both are neighborhoods with concentrations of affluent white residents. At P.S. 87 in District 3, for example, 65 percent of students are white, even though District 3 student enrollment on the whole is 27 percent white.
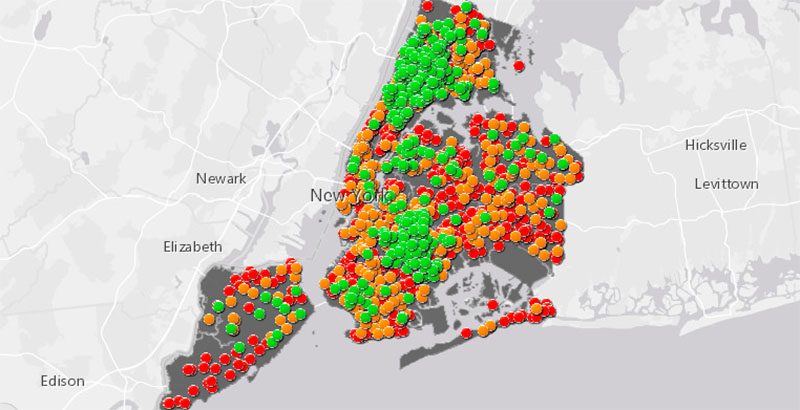
Hoping to help inform desegregation initiatives in the nation’s largest school district, the group released its analysis Jan. 7 alongside an interactive map. The map color-codes every public school with a red dot (“not representative”), an orange dot (“somewhat representative”) or a green dot (“representative”) based on how drastically its student body demographics deviate from the local district’s.
Systemwide, racial and ethnic diversity “is only one part of the story,” the report states. “While we want all our schools to be diverse, we also want schools to reflect the diversity within communities.”
The analysis comes amid mounting pressure to integrate New York City’s public schools, including almost weekly student protests demanding districtwide action. New York City is one of the most segregated school districts in the country, with only 28 percent of schools in the city considered diverse, widely defined as no one group exceeding 50 percent and no two groups exceeding 80 percent. City schools on the whole are 41 percent Latino, 26 percent black, 16 percent Asian and 15 percent white.
Systemwide integration efforts, however, are in a state of inertia. Proposals such as eliminating the entrance exam at the city’s elite specialized high schools, abandoning middle school admissions screens and scrapping gifted and talented programs have drawn ire, mostly from white and Asian-American parents. Mayor Bill de Blasio and Schools Chancellor Richard Carranza both seem reticent to commit to an expansive integration plan.
While diversifying schools citywide should remain the “long term” goal, Citizens’ Committee for Children of New York suggests local reform as an intermediate step — a stance that reflects recommendations made by the mayor’s School Diversity Advisory Group in February. It hopes its analysis and interactive map can serve as a guidepost of sorts for local officials and advocates.
“Diversity shouldn’t be ambitious,” said Daryl Hornick-Becker, a co-author of the analysis and a policy and advocacy associate. “Our hope with this is that [local] districts can — instead of looking at a standard definition of diversity and saying, ‘How do we get to that?’ — they can look at a more local definition [relating to representation] and ask, ‘Where are the problem areas in our district, what’s causing them to happen, and how do we fix this?’”
Community-level initiatives are already happening in parts of the city. A few districts have implemented integration plans, including Manhattan’s District 3, which the analysis called out for its segregated schools, and District 15 in Brooklyn, which eliminated selective admissions criteria at its middle schools this year — a move that seems to be working.
The NYC Department of Education has also approved $200,000 grants to support at least five other local districts’ integration proposals, and it recently green-lighted a Brooklyn elementary school’s decision to end separate gifted courses. More plans are imminent after the New York City Council approved a bill in November that will ultimately require every local district in the coming years to create one.
As with systemwide proposals, though, local integration plans can still elicit apprehension and vitriol. Earlier this month, parents in Queens District 28 turned out en masse at a public school board meeting to condemn preliminary discussions of a middle school integration plan, reportedly booing, shouting at one another and calling one another racist.
Nyah Berg, the integrated schools project director for advocacy group New York Appleseed, said starting to look locally to enact reform is vital in working toward a diverse and equitable system.
“We definitely don’t have all the answers, as of yet, working on systemic change in such a large system,” she said, noting that the “great data visualizations” in the Citizens’ Committee for Children of New York’s report help make some already-known information more accessible. “Breaking it down into those communities and making sure that they’re adhering to community needs, I think, is an incredibly important first step.”
Leanne Nunes, an NYC senior and director of equity for student advocacy group IntegrateNYC, said in an email Friday that integration “has never been a one size fits all approach. Each community and district has its own unique obstacles, and if we want to respect the people and uplift their power they should be allowed to change their environments in ways that are best for them. … [though they’ll still] be held accountable.”
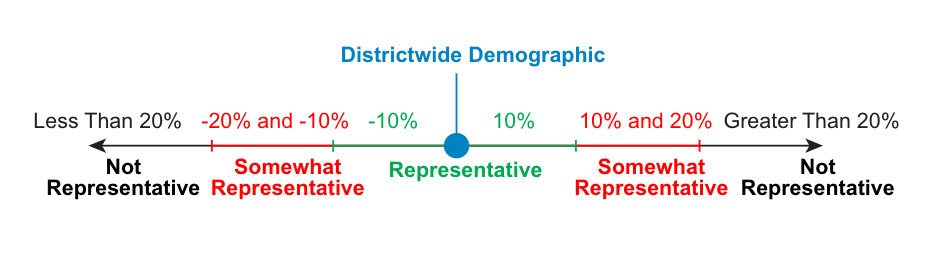
On the interactive map, a red dot means that a school’s enrollment by race/ethnicity is more than 20 percentage points off from the local district’s student demographics for at least one racial group. (For example, if a local district is 30 percent Latino students and a school’s student body is either less than 10 percent Latino or more than 50 percent Latino, that school is considered unrepresentative.) An orange dot indicates that a school’s demographics are between 10 and 20 percentage points off, while a green dot signals that they are within 10 percentage points.
The group based its definitions on School Diversity Advisory Group recommendations.
Key takeaways from the data:
1 Concentration of unrepresentative districts
Districts 2 and 3 in Manhattan, Districts 13 and 15 in Brooklyn and District 27 in Queens have the largest shares of unrepresentative schools. They contain 15 percent of the district’s schools, but almost a third of those that don’t reflect their local districts’ student enrollment, according to the analysis.
As of this school year, District 3 gave admissions priority for a quarter of its middle school seats to students who are low income, struggle on state tests and earn low report card grades. District 13 is also a recipient of one of the DOE’s $200,000 grants.
In order from least representative as of 2018-19:
● District 3 (Upper West Side): 83% of schools unrepresentative
● District 2 (Stuyvesant Town, Upper East Side): 76% of schools unrepresentative
● District 27 (Jamaica, Howard Beach, Rockaways): 73% of schools unrepresentative
● District 13 (Brooklyn Heights, Downtown Brooklyn): 72% of schools unrepresentative
● District 15 (Park Slope, Sunset Park): 69% of schools unrepresentative
2Concentration of representative districts
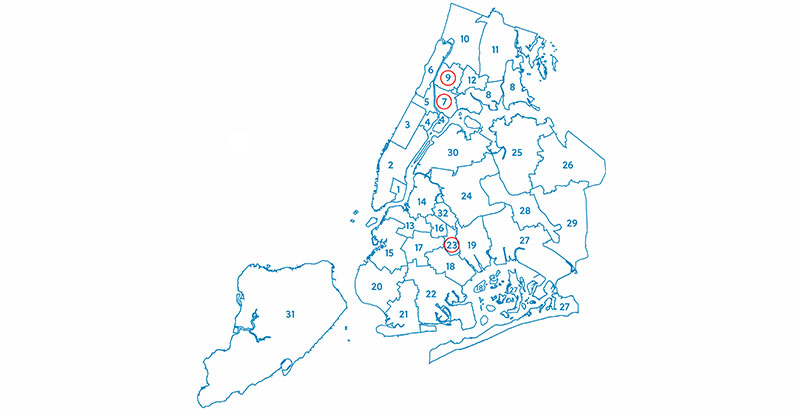
Local districts that are almost entirely black and Latino, however, see the inverse: a large percentage of representative schools. Districts 9 and 7 in the South Bronx, for example, have 60 and 71 percent of schools reflecting the local district’s demographics, respectively. A handful of districts in Brooklyn, including District 23 in Brownsville, record similar percentages. All three of those local districts are at least 95 percent black and Latino.
District 9 is also the recipient of a $200,000 DOE grant.
For research associate and report co-author Jack Mullan, these patterns serve as a reminder that some aspects of school segregation stretch “beyond the domain of education policy.”
“It’s broader — it’s housing segregation, it’s discrimination, it’s employment [opportunities]” and many other factors, he said.
City officials last week released a five-year “fair housing” action plan, Where We Live NYC, that addresses the underlying segregation and proposes solutions such as bolstered resources to combat persistent housing discrimination, along with plans to add and preserve affordable housing and encourage broader acceptance of housing vouchers.
When asked whether these particular data suggest that representation doesn’t always achieve diversity, New York Appleseed’s Berg pointed out that racial composition is only a surface indicator of who students are.
“I’d also be curious to see those dots broken down by the representation of English language learners, students with disabilities, [students with] free and reduced-price lunch,” she said. “And when we say black and Latinx, we also know that within those groups, there’s also West Indian, there’s Mexican-American, there’s Salvadoran. … There’s diversity within this data.”
3 Elementary schools most likely to be unrepresentative
Elementary schools make up 55 percent of unrepresentative schools, the analysis found. Comparatively, 13 percent are middle schools and 31 percent are high schools.
There are more elementary schools total districtwide than there are middle or high schools, likely contributing to the disparity. The report’s authors also reasoned that segregation at the elementary school level is exacerbated in part by families “exercis[ing] school choice to send their children to out-of-zone elementary schools they consider better academically.”
Citing the Center for New York City Affairs, the analysis added that white families often “choose schools that have more White children than their zoned schools do. Black and Hispanic families, on the other hand, choose schools with the same proportion of Black and Hispanic children as the schools to which they were zoned.”
4 Charter vs. district school representation
In an independent review of the advocacy group’s data set, The 74 noted that 41.3 percent of non-charter schools do not reflect their local district’s student body, compared with 40.4 percent of charters.
Inversely, charters are slightly more likely to have representative schools, at 30.7 percent, versus 26.3 percent of non-charter schools.
“It’s not surprising that charters would have a slightly higher share of representative schools than their district counterparts,” as charters “tend to be both majority-minority [in terms of enrollment] and located in areas with concentrated minority populations,” a staffer with Citizens’ Committee for Children of New York wrote in an email Thursday.
The staffer added, “As we move from tackling factors contributing to segregation at the local level to effecting large scale changes that bring us closer to citywide diversity, charters will have an increasing role to play in that effort.”
5 Admissions screens a likely contributor
Schools with some type of admissions screen — excluding those that are designed for English learners— are more likely to be unrepresentative of their local districts, according to the analysis.
Broken down by school level:
● 58 percent of screened middle schools are unrepresentative, compared with 27 percent of unscreened middle schools.
● 53 percent of screened high schools are unrepresentative, compared with 33 percent of unscreened high schools.
The second round of the School Diversity Advisory Group’s recommendations released in August called for a moratorium on all new screened high schools and the elimination of screens in middle schools. More than 20 percent of New York City’s middle and high schools have admissions screens.
The nonprofit says it’s been in touch with student groups such as IntegrateNYC and Teens Take Charge — which has spearheaded the recent near-weekly student protests — and aims “to engage them further on how [the data] could benefit their specific goals.”
Nunes from IntegrateNYC indicated Friday that the group intends to use the new tools, writing that it relies heavily on data “to inform the decisions and policies we make.”
“Monitoring how things are changing district by district and even school by school if necessary is very useful,” she said.
Get stories like these delivered straight to your inbox. Sign up for The 74 Newsletter
Taylor Swaak is a correspondent at The 74, focused on the coronavirus pandemic, its impact on student learning, and how the Washington, D.C. region is approaching the many urgent challenges caused by the public health emergency.
@tswaak27 [email protected]