Despite some earlier encouraging results, this latest study — whose release was delayed for a few months, for unknown reasons — amounts to a major indictment of the administration’s strategy to improve the nation’s lowest-achieving schools.
The very next day, though, without mentioning the new research, former secretary of education Arne Duncan touted the $7 billion school turnaround program as producing “encouraging” results.
“We were confident that smarter, better policies could make a big difference for our kids,” Duncan wrote in Time magazine. “Today, the evidence makes that clear.”
Meanwhile, the program’s reported failure has produced a round of I-told-you-so’s by longtime skeptics, such as Andy Smarick, a resident fellow at the American Enterprise Institute and head of the Maryland state school board, who called the SIG results “devastating to Arne Duncan’s and the Obama administration’s education legacy.” This produced a defense by Peter Cunningham, assistant secretary for communications in Obama’s Department of Education, who said, “The shame is that something good happened in many of these schools. There is anecdotal information everywhere.”
It’s obviously important to know whether SIG was successful, but perhaps even more crucial is understanding why the program apparently fell short of expectations, and how turnaround efforts, which must still be undertaken by states under the Every Student Succeeds Act, might learn from both its wins and its losses.

“We have to always think about the context of these studies,” said Katharine Strunk of the University of Southern California, who has studied turnaround efforts in Los Angeles. “The one-size-fits-all approach may not be the best approach.”
The short takeaway: It’s complicated.
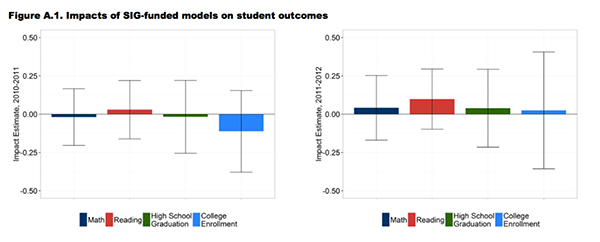
At first this answer seems straightforward. The study, conducted by the respected research firm Mathematica, concluded, “Overall, across all grades, we found that implementing any SIG-funded model had no significant impacts on math or reading test scores, high school graduation, or college enrollment.” This is particularly disappointing given the $7 billion spent. (To put that number in context, it’s about one quarter of this year’s New York City schools budget.)
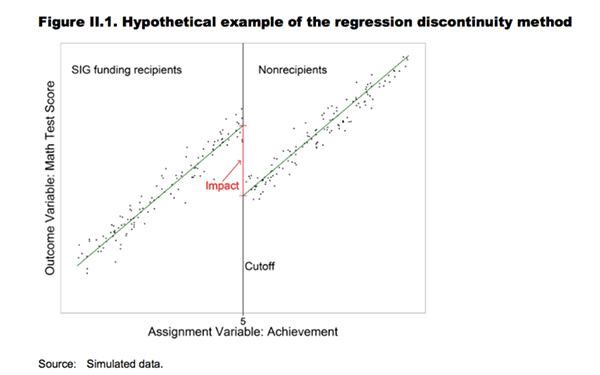
To reach their conclusion, the researchers compared schools that could receive a turnaround grant with schools that just missed the eligibility threshold. The idea — known to researchers as a “regression discontinuity” — is that schools on either side of an arbitrary point are similar: the bottom 5th percentile of schools, which were eligible for SIG, compared with the bottom 6th percentile, which weren’t.
This is a widely used and appropriate method, but it does have an important limitation: The results might not generalize to the SIG schools not studied — that is, those not close to the eligibility cutoff. The research examined 190 SIG-eligible schools near the cutoff point. In total, 850 struggling schools implemented a SIG turnaround model.1
The report acknowledged this: “Study schools implementing a SIG-funded model were generally not representative of all U.S. schools implementing such models.” The SIG schools left out of the study had slightly lower rates of poverty and were much less likely to be in urban areas.
(The 74: Connecticut’s Shame: In One of America’s Richest Counties, a High School Has Been Failing for 50 Years)
The question of generalizing the outcomes of 190 schools to 850 is especially relevant because a study of turnarounds in North Carolina found that the regression discontinuity method showed no effect in lower grades, but another approach looking at all schools showed positive impacts. Still, a separate study in California showed positive results for SIG using the same discontinuity method, so it’s not as if it’s inherently biased against improved outcomes.
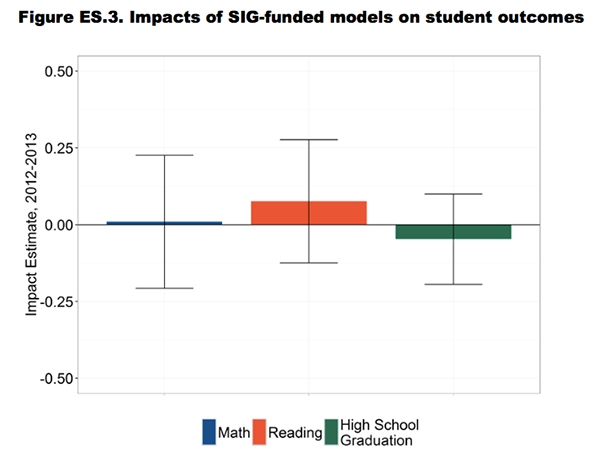
Another issue with the federal report, as raised by Neerav Kingsland, is that the results have large statistical margins of error.
“I wouldn’t say we can show that [School Improvement Grants] didn’t work,” said Strunk. “We just can’t show that it actively did work.”
What that means is that estimates of effects are not precisely measured because the sample sizes are small. This would be a bigger concern if the estimated impacts more clearly pointed in one direction, positive or negative, but were still not statistically significant.
In fact, the researchers estimated small positive effects on reading test scores, small negative effects on high school graduation and essentially no effect on math test scores. Because they fell within the margin of error, the researchers reported that they could detect no impact.
The study should be interpreted in light of other evidence showing positive effects of federal turnarounds in California, Massachusetts, North Carolina and an anonymous urban district, but mixed or no effects in North Carolina (from a different study), Rhode Island, Michigan and Tennessee. It’s also worth considering research on past local turnaround programs similar to federal efforts, such as those finding encouraging results in Philadelphia and Chicago but mixed evidence in Los Angeles.
In sum, the latest research — the first to look at a national sample of SIG schools — provides some evidence that the program was not successful. It should be interpreted cautiously, though, as one study, which, like all research, has important limitations.
It’s hard to pinpoint why the program has not produced clear positive results, but there appears to have been a number of challenges in implementing it.
One study, whose authors spoke to school and district leaders overseeing SIG grants, stated, “District administrators we interviewed lamented the lack of adequate time to devise comprehensive turnaround plans and fill the teacher and principal vacancies.” A report from the federal Government Accountability Office found that schools struggled to put in place the many aspects of the turnaround models, such as new teacher evaluations and extended school days. The same report also found that the Department of Education didn’t have a strong protocol for monitoring the performance of outside contractors, who were often hired by SIG schools.
Strunk’s Los Angeles research showed, unsurprisingly, that turnaround programs are unlikely to work — and may even backfire — when rushed or poorly put in place. Strunk said creating time to build capacity within schools — in her study, under one model that was effective, the district made time for two weeks of planning for teachers at turnaround schools — may be crucial. “When you just shake up the staff in the school, that probably isn’t enough,” she said.
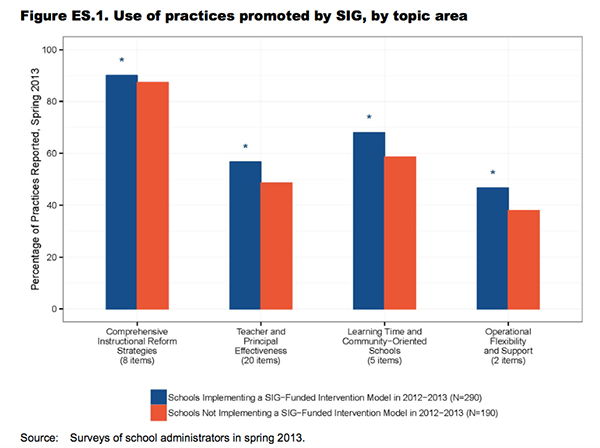
The federal SIG study also shows that schools receiving a grant did not necessarily follow through with the practices promoted by the initiative. The program lists 35 such practices — ranging from teacher evaluation to greater flexibility — but SIG schools reported using only about 23 of them, on average, while the comparison non-SIG schools used almost as many, about 20.
Not necessarily, particularly since recent research has shown that court-ordered infusions of new money have led to meaningful improvement in schools. Still, the study underscores the importance of ensuring that additional resources are spent wisely.
The impact of money is also complicated because dollars from SIG may not have always reached the schools they were meant for. If state or district leaders realized that a school would receive a turnaround grant, they might have cut local money from such a school under the logic that they were already getting new money from the feds. (In Washington parlance, the SIG dollars would be “supplanting” rather than “supplementing” local dollars for these already high-poverty SIG schools.)
In the 2011–12 school year, the study could not show that SIG money reached the schools as intended; in the 2012–13 year, the money did seem to make it to SIG schools.
Notably, the estimated effects of SIG in 2012–13 appear more positive than in 2011–12 — though the differences are not statistically significant and so should be interpreted very cautiously.
School Improvement Grants required schools to implement one of four strategies.
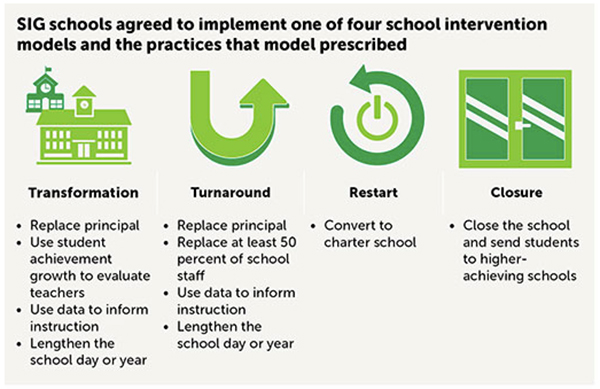
The vast majority chose the least disruptive approach, known as “transformation,” while very few schools converted schools to charters and even fewer closed altogether.
The study looked at correlational evidence on whether one strategy was more effective than the others. (It excluded closures because so few schools used that option.) That means the research can’t definitively prove cause and effect but does provide suggestive evidence.
In elementary school, there was no apparent differences among strategies.
In higher grades, the turnaround model (firing the principal and half the staff) and the restart model (converting to a charter school) produced better results than the commonly used transformation approach. However, according to the study, the charter conversion gains seemed to be largely because the new school took on a more advantaged student population, not because the school was much better.
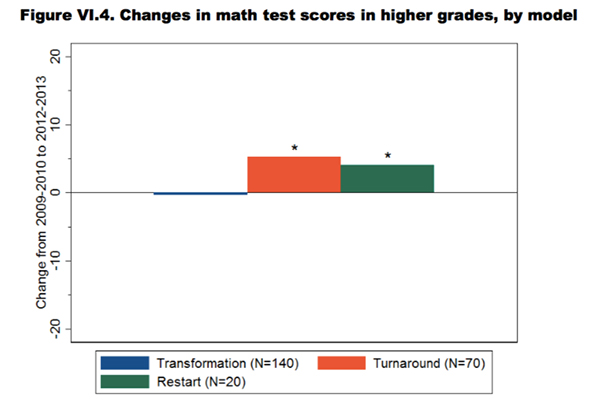
But the improvements from turnaround seem to hold upon closer examination. This aligns with research from California showing that this model led to big improvements.
The study of Los Angeles’s (non-SIG) turnaround program in which, similarly, half the staff and the principal were dismissed — but which came alongside other supportive measures — showed that it led to substantial improvements, unlike more-incremental turnaround attempts.
Some argue that the disappointing SIG results mean the Trump administration should expand school choice programs, rather than attempt to improve struggling public schools.
“The now-documented failure of the administration’s massive ‘school turnaround’ program offers a convincing argument for empowering disadvantaged families with more educational options,” wrote Smarick in U.S. News and World Report.
As mentioned, charter conversion was an option under SIG, but it didn’t seem to be more effective than other options, though only a small number of schools (33 of the 850 schools implementing a SIG model) used this approach.
Research on charter takeovers in Boston and New Orleans showed that they led to dramatic test score gains, but not in Tennessee. Interestingly, other studies show charters in all three places — Boston, New Orleans and Tennessee — performing very well, so it’s unclear why Tennessee's charter takeover model was unsuccessful.
Some states, like Florida and Ohio, provide vouchers to help students in low-rated public schools attend private schools. The idea is that it gives students an alternative and may spur struggling schools to improve. Research shows that public schools often do, in fact, get better in response to competition from vouchers, but that students who use vouchers to attend private schools usually don’t score much higher on standardized tests and may even score lower. Some studies find that vouchers have positive effects on high school graduation and parental satisfaction.
This was an option under SIG, but it was used in only 16 instances. There is no research on how effective it was in those few cases, but we can look at other studies on the question. Not surprisingly, students seem to benefit when their schools close if they end up attending better ones. A study of New York City’s large number of closures found that future students — those who would have otherwise attended the low-performing schools that were closed — were especially likely to benefit. Students who were directly affected by closures, usually meaning their school was phased out, were neither hurt nor helped.
Some skeptics of the SIG approach agree that struggling schools should receive additional resources but take issue with the relatively narrow band of turnaround options. Some have advocated for turnaround approaches that emphasize integration, school culture and teacher collaboration or community schools.
These approaches have mixed evidence.
There is research strongly supporting the idea that school integration improves outcomes for disadvantaged students. However, there is less evidence on integration specifically as a turnaround strategy. It may be difficult to implement, and if done successfully it would mean, by definition, changing the composition of students at a school and thus displacing some number of students, unless the school expands.
Similarly, there are many studies confirming that a high-quality school culture benefits students and teachers alike. But creating that culture in struggling schools is not always easy. Transformation, the most common turnaround model, emphasized improving professional development for teachers and making the school more community oriented. This on average did not seem to have an impact. A study of turnarounds in North Carolina found that teachers spent significantly more time training and collaborating — but to no evident effect on student achievement.
Another alternative is the creation of community schools, which attempt to address out-of-school factors, like poverty or health, that could negatively affect learning. The empirical evidence for this approach to turning around schools is encouraging, albeit relatively small. A Boston-based community schools program, known as City Connects, spends about $500 per pupil to help connect students to beneficial city services such as health care or counseling. The program has produced impressive results for students based on both grades and standardized test scores.
“These SIG strategies don’t look at [the] underlying problems,” of low student achievement, said Elaine Weiss of the Broader, Bolder coalition, which advocates for a holistic approach to school improvement.
New York City Mayor Bill de Blasio has emphasized a community schools approach in his attempt to improve struggling schools in the country’s largest school district. The $400 million program to turn around 94 schools in three years has had a number of challenges, including declining enrollment, which forced the closure or consolidation of nine Renewal schools, and failure among nearly half of the targeted schools to reach the city’s goals. The program has not been rigorously studied yet.
Schools were chosen as eligible for SIG based largely on whether they were among the lowest-achieving 5 percent of schools in the state or, in the case of high schools, had a graduation rate below 60 percent. That means that how a given state judges performance is key.
“We don’t do a good job of identifying which schools actually are low-performing,” said Weiss.
Since proficiency rates are a poor measure of school quality, attempting dramatic turnaround — including firing the principal and perhaps staff — based on such measures might be misguided, particularly if students are making growth over time. Those schools might be most likely to benefit from additional supports and resources. The truly dysfunctional schools, where students are making little progress, may be the ones where more sweeping changes are needed, including potential closure.
Similarly, the effectiveness of strategies for schools in rural versus urban areas may vary. Rural schools in particular have reported that the model that required dismissing half the teaching staff would be next to impossible to execute because it would be difficult to find replacement teachers; urban schools with more robust labor markets might not have that challenge to the same degree.
Unfortunately there appears to be little research on these questions.
Moving forward under ESSA, states will have additional flexibility in designing accountability systems, including the use of nonacademic factors, in order to identify and intervene in the bottom 5 percent of schools.
Figuring out how to measure schools and determine the right fit between school and turnaround strategy may be the key — as well as the hardest part — to success.
1. This number does not include the 403 schools that received a School Improvement Grant (under Tier III recipients) but were not required to implement one of the four turnaround models. (return to story)
Get stories like these delivered straight to your inbox. Sign up for The 74 Newsletter


;)
