The States That Spend the Most (and Least) on Education — and How Their Students Perform Compared With Their Neighbors

Across the United States, current expenditures for public K-12 education rose by over $18 billion during the 2014–15 school year, according to a new report released by the National Center for Education Statistics. That uptick was part of a 5 percent increase since fiscal year 2013, and total expenditures stood at $575 billion overall for the year.
In a development that may not prove shocking to education observers, many of the highest-spending states are thought to boast the best school systems.
The annual report tracks both revenues and expenditures over time in all 50 states and the District of Columbia, breaking down the costs of instruction, administration, operations, transportation, food, and other support services. “Current expenditures” describes the amount spent by schools on day-to-day operations, excluding construction, property, and debt service.
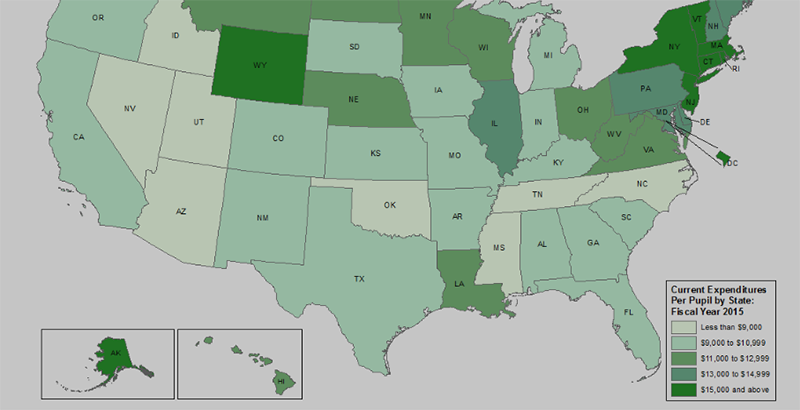
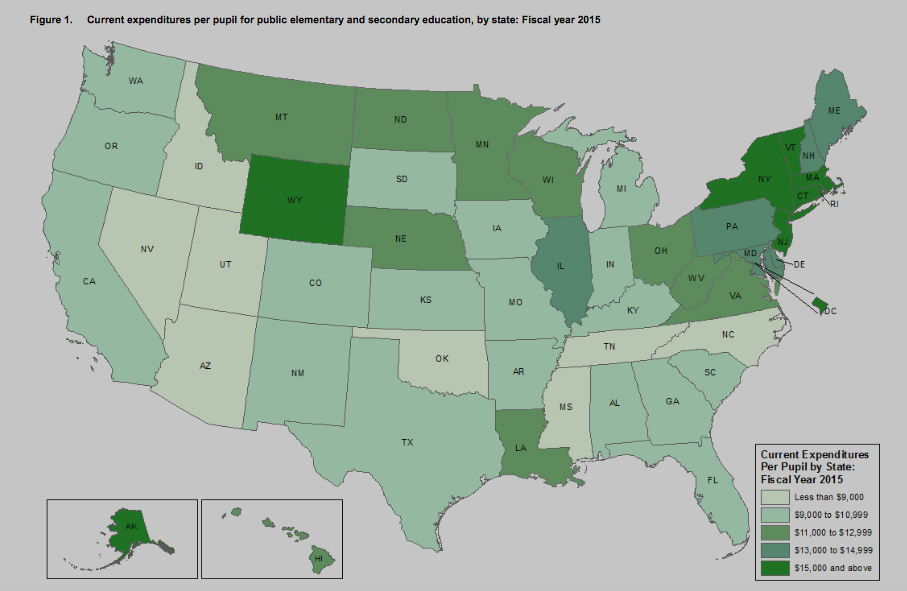
Continuing a recent trend, the state of New York spent the most money per pupil: $20,744, more than three times the $6,751 spent in Utah, where expenditures are the lowest.
New York was one of seven states, as well as the District of Columbia ($20,610), that exceeded the national per-pupil average ($11,454) by 40 percent or more. Those states were Alaska ($20,191), Connecticut ($19,020), New Jersey ($18,838), Vermont ($18,769), Massachusetts ($16,566), and Wyoming ($16,047).

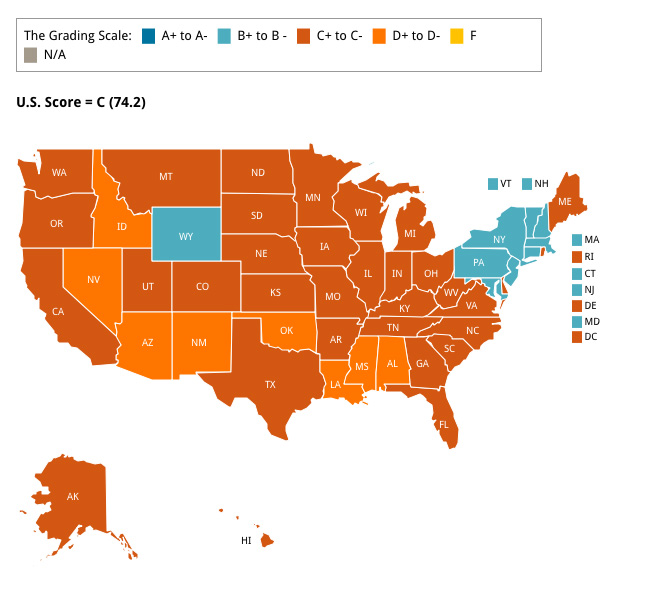
Notably, of those eight highest-spending jurisdictions, six were among the 10 highest-rated states for overall school quality in Education Week’s 2017 Quality Counts state-by-state report cards. The annual ranking, a respected barometer of school success that takes education finance into consideration, tabbed Massachusetts in first place, New Jersey in second, Vermont in third, Connecticut in sixth, Wyoming in seventh, and New York in ninth. The District of Columbia, plagued for decades with a reputation for underachieving schools, falls closer to the middle of the pack, but recent assessments have indicated that its system is among the fastest-improving in the country.
Among the lowest-spending states, Nevada ($8,451), Mississippi ($8,445), Idaho ($6,899), Oklahoma ($8,075), Alabama ($9,146), Arizona ($7,590) and Texas ($9,081) ranked 51st, 50th, 48th, 47th, 45th, 44th, and 40th, respectively, in the “Quality Counts” ratings.

The link between per-pupil spending and educational quality is much debated in research. Skeptics of greater spending have pointed to lackluster results from the U.S.’s titanic annual expenditures on education, but a series of recent research studies have documented learning gains and increased college attendance for students in school districts where spending had surged.
Other findings of note:
- In only four states did per-pupil current expenditures decrease between FY 2014 and FY 2015: Arkansas (–0.2 percent) Delaware (–0.1 percent), the District of Columbia (–0.4 percent), and New Jersey (–0.4 percent).
- Alaska, whose state coffers are directly linked to the price of oil that sits beneath its soil, saw the largest increase in spending between 2014 and 2015: 8.6 percent. In the Lower 48, California led the spenders with a 7.3 percent increase over that year, followed by Texas (4.8 percent), Illinois (4.7 percent), Maine (4.6 percent), and Oregon (4.2 percent).
- Of the nearly $650 billion in education revenues collected over FY 2015, $593.6 billion (91.5 percent) were collected at the state and local levels. Just $55 billion (8.5 percent) came from federal funding.
Get stories like these delivered straight to your inbox. Sign up for The 74 Newsletter

;)
