Analysis: Is Chicago Really America’s Fastest-Improving Urban School District? Why Claims Made by the NYT & Others Are Misleading

A recent New York Times article suggested that Chicago had the nation’s fastest-improving large urban school district. In it, reporters Emily Badger and Kevin Quealy summarized data from a new study by Sean Reardon of the Stanford University Center for Education Policy Analysis.
For many, that was surprising news, since the district has received heat for inflated graduation rates and three years of flat scores on PARCC (Partnership for Assessment of Readiness for College and Careers) tests, which reveal that only 1 in 4 CPS elementary students reads at grade level.
A look at more comprehensive data makes it clear that while Chicago did improve from 2009 to 2014, New Orleans and Washington, D.C., have improved faster. A key reason for rapid improvement in all three cities appears to have been aggressive replacement of failing schools with stronger schools, most of them charters. Unlike in New Orleans and D.C., however, Chicago’s leaders virtually halted charter growth five years ago — which could explain the stalled growth since 2014.
Unlike other studies, Reardon’s study uses cohorts of students — following all third-graders through to eighth grade, for instance. Reardon used 2009 to 2014 scores on the Illinois Standard Assessment Test (ISAT), Illinois’s pre–Common Core test, to conclude that “Chicago’s students’ scores improved dramatically more, on average, between third and eighth grade than those of the average student in the U.S.”
That statement is surely true. Reardon demonstrated that Chicago’s students gained six years of learning in five years between third and eighth grade. In 2008–09, third-grade students scored, on average, about 1.4 grade levels below the national average in math and English language arts (ELA), but in eighth grade that same cohort scored only 0.4 grade levels below the national average.
Chicago deserves credit for this progress. But a Times chart showing Chicago with the highest academic growth of any American city — along with its statement that Chicago students “appear to be learning faster than those in almost every other school system in the country” — is quite misleading. This is true for several reasons: test scores tell different stories depending on how they are analyzed; third- through eighth-grade scores capture only part of the picture; and test scores are only one measure of success.
Let us start with the first point. Reardon groups all of a city’s public schools into “geographic school districts” and then records the estimated mean state test scores in math and English language arts for all students. He compares cohort proficiency scores over time (e.g., the scores of third-graders in 2009 to those of fourth-graders in 2010 to those of fifth-graders in 2011). However, when the estimated mean test scores of the geographic school districts are used to compare the scores of third-graders in 2009 with those of third-graders in 2010 with those of third-graders in 2011, and so on, Reardon’s data show both New Orleans and the District of Columbia improving faster than Chicago between 2009 and 2014.
Other Test Score Data: New Orleans Ranks First
Now let us consider other grade levels and other test scores.
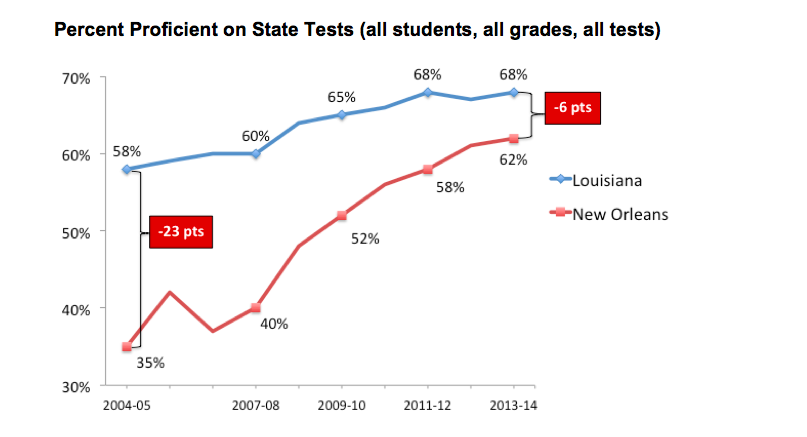
In the wake of Hurricane Katrina, Louisiana turned a desperate situation into an opportunity. Two years prior to the 2005 storm, the governor and state legislature had created a Recovery School District (RSD) to take over the state’s worst public schools. After the storm, the legislature placed all but 17 of New Orleans’s public schools in the RSD, and over nine years, the RSD handed them to charter operators. In the decade after Katrina, New Orleans schools improved faster than those of any other city in the nation, by most important metrics.
Before Katrina, 60 percent of New Orleans students attended a school with a performance score (based largely on test scores) in the bottom 10 percent of the state. A decade later, only 13 percent did.
In the RSD schools in New Orleans, only 23 percent of students tested at or above grade level in the spring of 2007, the first full school year after the storm. Seven years later, 57 percent did. RSD students in New Orleans improved almost four times as fast as the state average.
The Orleans Parish School Board, which got to keep only those schools performing above the state average (many of them selective magnet schools), also turned most of its schools into charters. Adding its students into the mix still reveals extremely rapid improvement over the period Reardon studied.
In his study, Reardon focused only on growth in grades three through eight. In New Orleans, students in grades three through eight went from 37 percent testing at grade level or above in 2007 to 63 percent in 2013, the last year before the test began to change to align with Common Core standards. (These figures average math, ELA, and science scores.) That’s almost a doubling in the percentage of students testing at grade level in just six years.
Illinois’s ISAT test began to change in 2013, so a fair comparison would stop in 2012. In Chicago, between 2007 and 2012, the percentage of third- through eighth-grade students testing at grade level or above grew from 64 to 74 (also averaging math, ELA, and science scores). In high school (where the test remained the same), 29 percent tested at grade level in the spring of 2007, compared with 32 percent in 2013. This was improvement, but nothing close to what happened in New Orleans.
Beyond Test Scores
America has been obsessed with test scores since the No Child Left Behind Act passed in 2002, but most education researchers, including Reardon, acknowledge that other metrics are important in judging a district’s success. Perhaps the most important are high school graduation rates and college-going rates.
Before Katrina, roughly half of public school students in New Orleans dropped out and fewer than 1 in 5 went on to college. In 2015, 76 percent graduated from high school within five years, a point above the state average. In 2016, 64 percent of graduates entered college, six points above the state average.
From 2005 to 2015, Chicago Public Schools’ five-year graduation rate (for district and charter schools) increased from 52 percent to 70 percent, which remained 18 points below the state average. College enrollment rates rose from 50 percent of graduates in 2006 to 64 percent in 2015 but remained six points below the state average. Again, significant improvement, but not as rapid as in New Orleans.
Douglas Harris, a professor of economics at Tulane University and director of the Education Research Alliance for New Orleans, lead a research study to determine whether the reforms there had driven improvement or if other factors, such as demographic shifts, were responsible. Harris found that demographic change accounted for only 10 percent of the progress, at most. His 2015 conclusion: “We are not aware of any other districts that have made such large improvements in such a short time.”
How About Washington, D.C.?
To test his conclusions from Illinois’s ISAT data, Reardon also analyzed how Chicago performed on the National Assessment of Educational Progress (NAEP). NAEP is given every two years in fourth and eighth grade to a random sample of students representative of each state and 21 large urban districts. NAEP is widely considered a reliable standardized assessment, because there are no stakes attached. No one is rewarded or penalized based on how students perform, so there’s no teaching to the test or test prep.
New Orleans is not one of the 21 urban districts, but the District of Columbia is. Reardon again used cohorts of students, this time from fourth to eighth grade, to measure growth. Unlike ISAT, however, NAEP is not given to the same set of students each year. If an entirely different sample takes the test the second time than the first, is it realistically possible to show growth within a cohort?
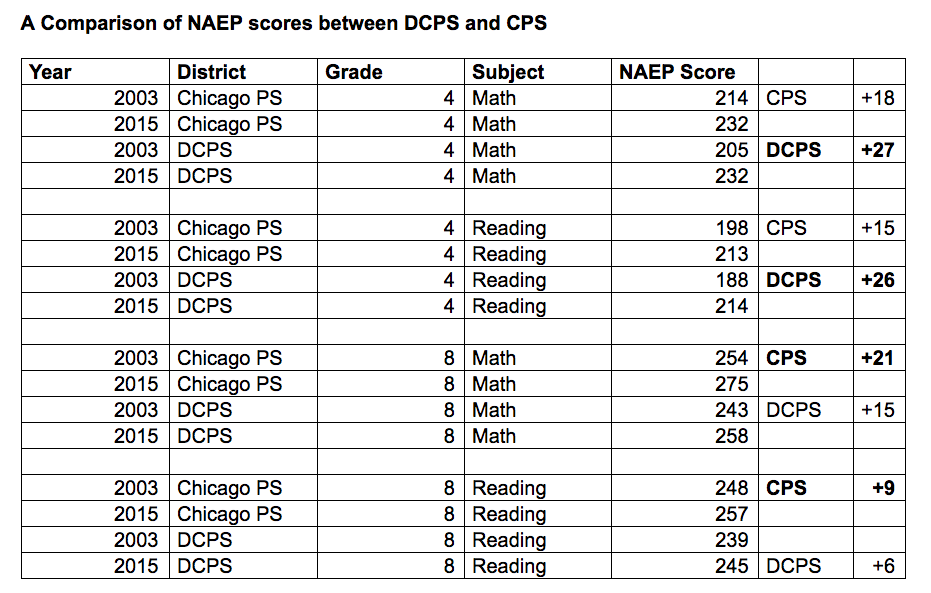
Ignoring cohort growth and looking simply at scores every two years, Chicago has shown significant growth on NAEP, but progress in D.C. has been faster.
If the four scores above are averaged out, District of Columbia Public Schools (DCPS) averaged 18.5 points of growth over those 12 years, while CPS experienced 15.75. (Ten points is considered roughly the equivalent of one year of learning, so both cities improved rapidly.)
In 2009, NAEP began to include public charter schools authorized by districts in its results, which means that Chicago’s data from 2009 on includes charter students. D.C.’s charters, which educate 47 percent of public school students in the city, are authorized by a Public Charter School Board, not by the district, so they were not included in the chart above.
Comparing district plus charter schools in both cities shows an even larger lead for D.C.
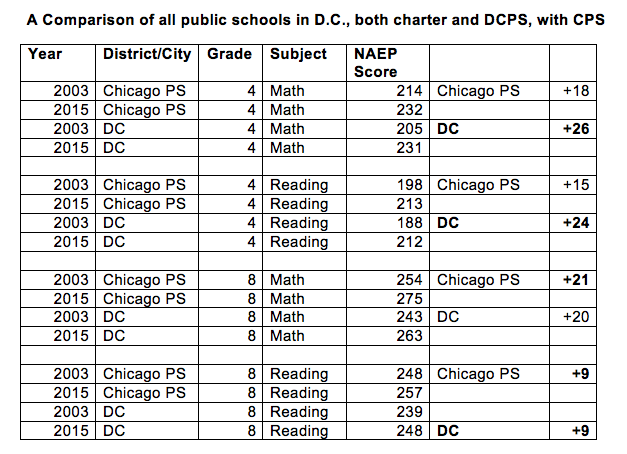
The average improvement across all four scores in DC was 19.75 points, compared with Chicago’s 15.75.
Did Chicago Peak Before PARCC?
Because Reardon used ISAT scores as the basis for his analysis, he looked only at Chicago’s results before 2015. But in the three years since Illinois switched to the PARCC tests, district scores have been flat at best.
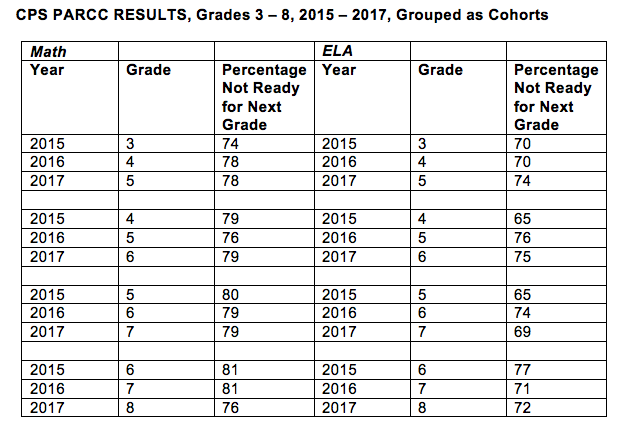
Only about 25 percent of third- through eighth-grade students in CPS are ready for the next grade, based on the results of their math and reading PARCC tests. When grouped as cohorts, as Reardon did with the ISAT data, the percentage of students unprepared for the next grade level has often increased, as the table below shows.
The trend of Chicago’s students being unprepared for the next grade level appeared to continue through high school, because almost two-thirds of the graduating class of 2015 who were enrolled at community colleges had to take remedial courses, 17 percentage points higher than the state average.
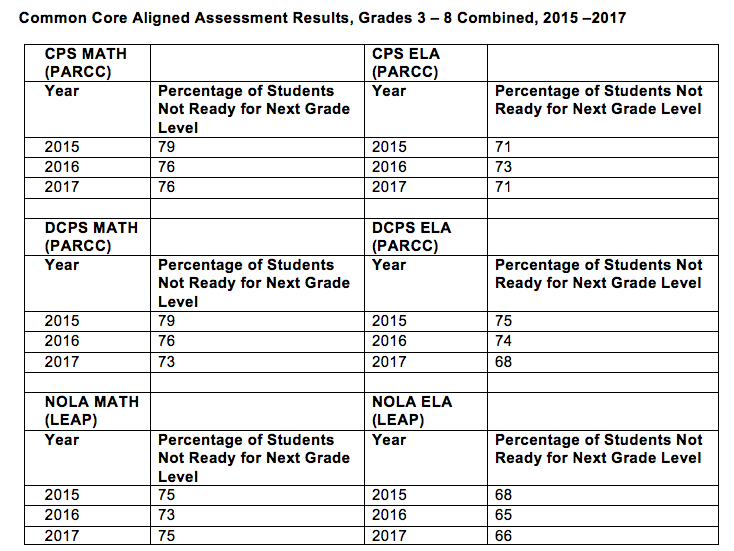
DCPS students also take the PARCC tests, and a large portion of them are also behind grade level. But as the table below shows, DCPS has shown steady reductions in this number. Public school students in New Orleans took PARCC exams in 2015, which the state board then changed slightly in 2016 and 2017, though they are still somewhat comparable to PARCC. The results for all three cities are shown below.
Why Has Progress Stalled in Chicago?
Without a doubt, Chicago Public Schools improved over the five-year period that Reardon studied. But over the past few years, test score improvement has stalled. Part of the reason may be that PARCC tests are far more demanding than their predecessors and put low-income students at a greater disadvantage. But part of the explanation may lie with Chicago’s freeze on charter schools.
After Katrina, New Orleans gradually converted its public schools to charters — a process that will culminate when the last four schools convert next summer. Many failing schools were closed and replaced by stronger school operators, and Douglas Harris and his colleagues concluded that 25 percent to 40 percent of the improvement resulted from such replacements.
The District of Columbia also embraced charters. Not only have D.C.’s charter schools shown consistent growth, but the competition they created led to reform of the district, which has also improved rapidly. Both sectors have replaced many failing schools.
For many years, Chicago was also a leader in chartering; when it hit state limits on charter numbers, it created “contract schools” — charters by another name. In 2004, Arne Duncan, then superintendent, announced “Renaissance 2010,” an improvement plan that closed more than 60 failing schools and opened 92 (of an intended 100) new schools — many of them charters — on performance contracts with the district. The first cohort of Renaissance 2010 schools opened in 2005, and by 2010, the district had opened all 92. Because the school board authorizes Chicago’s charter schools, their success boosted CPS’s test scores.
A 2015 Urban Charter School Study by Stanford University’s Center for Research on Educational Outcomes (CREDO) showed that while students who attended public charters in Chicago learned about as much in English language arts as demographically similar CPS students with the same past test scores, they learned the equivalent of 14 days more in math every year. Students in poverty attending charters gained 27 days in math and 34 days in ELA.
Similarly, a new report by the University of Chicago Consortium on School Research found that charter high school students scored significantly better on standardized tests in 10th and 11th grade than similar students in district schools. The charter students had higher rates of attendance and graduation, and enrollment at four-year colleges and universities was significantly higher among students graduating from charter schools. The study also commented on school climate at public charters in Chicago — a crucial aspect of a creating a positive learning environment, especially in a district where security guards outnumber counselors in public schools. It noted that both teachers and students reported feeling significantly safer in charters than in non-selective traditional public schools. (Charters are also non-selective.)
The contract schools and others that replaced failing schools also performed well in Chicago. In all three cities — and nationally, according to numerous studies — replacing failing schools with stronger operators has been far more effective than trying to turn around failing schools.
But in 2013, when Chicago Mayor Rahm Emanuel decided to close 47 schools for financial reasons, he promised not to give any of the empty buildings to charter operators, effectively ending charter expansion. Just last year, Emanuel agreed to a new labor contract that will limit the growth of charter enrollment to 1 percent over three years.
The surge, then halt, in charter expansion might help explain why Chicago’s public schools improved so rapidly from 2009 to 2014 and then leveled off. By stifling charters, the city may have stifled the academic growth of its students.
If Chicago wants to once again be a rapidly improving district, it should continue to replace failing schools with autonomous, accountable public schools of choice, operated by nonprofit organizations — whether it calls them charter schools, contract schools, or something else. In the 21st century, such schools are producing urban America’s most rapid growth, in New Orleans, in D.C., and in other cities with strong charter laws and practices.
Emily Langhorne, a former high school teacher, is a policy analyst at the Progressive Policy Institute (PPI), in Washington, D.C. David Osborne, who directs PPI’s education work, is the author of the new book Reinventing America’s Schools: Creating a 21st Century Education System.
Get stories like these delivered straight to your inbox. Sign up for The 74 Newsletter

;)
