Not All Student Growth Is Created Equal — How 48 States Are Using It Differently in Their Report Cards

;)
Untangle Your Mind!
Sign up for our free newsletter and start your day with in-depth reporting on the latest topics in education.
If performance data says how well students achieved in the past, growth data can indicate a lot more: how performance has changed over time, which schools are making a difference in low-income neighborhoods and where student achievement might be headed in the future.
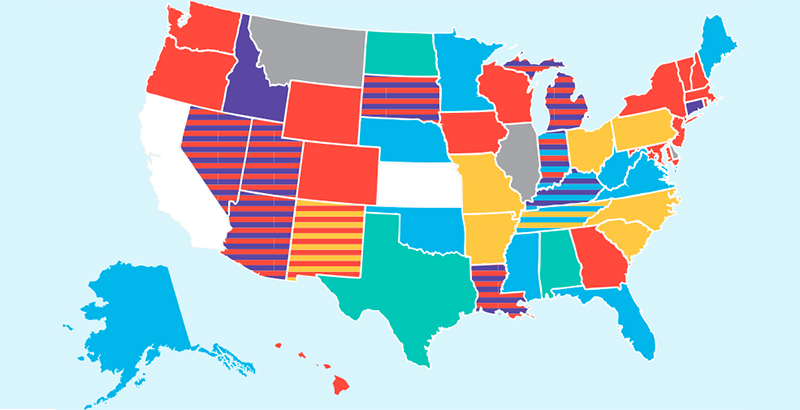
That’s why growth data is so powerful, said Paige Kowalski, executive vice president of the Data Quality Campaign. After the Every Student Succeeds Act encouraged states to track growth, 48 states and Washington, D.C., are now sharing this data on their public report cards. Now, a new report from the Data Quality Campaign shows the different ways they’ve done so, and what stories those data points can tell the public.
There are five ways most states are measuring growth — and some are using a combination of methods. These are: value added, student growth percentile, value table, gain score and growth to standard. Kowalski said the report doesn’t recommend one measure of growth over another, but rather, shows how different ways of measuring growth can imply different things.
“Every data point has its limitations. Every data point can answer some questions better than others,” she said. “No data point is perfect.”
Looking at growth rather than just performance data can shine a light on schools that have been helping students improve but may not receive recognition for doing so because overall proficiency rates are low, Kowalski said. It can also indicate to state leaders and other schools that there could be methods nearby worth learning from.
“If a school has low proficiency and high growth, there’s something magical worth looking at,” Kowalski said.
Here are the five main measures of growth that states are using, and the different stories they can tell.
1 Value added
Eight states are using this measure, which indicates how schools helped impact student achievement. The measure takes into account past performance and factors such as economic background or whether a student is an English learner, so it can predict how well a student with these circumstances should perform and compare that with how well the student actually performed. This method is able to show how specific schools helped students grow. However, it doesn’t say how well students performed compared with grade level standards, and it can be a challenging data point to communicate to the public, the report said.
2 Student growth percentile
This is the most popular growth measure, with 24 states using it. To calculate growth, each student is grouped with other students who have similar past academic performance. Then, based on their current test scores, students are given a percentile rank to show how well they performed compared with these peers. This method shows how students who started at the same place academically grew, but it does not say how well students grew compared with grade level standards and doesn’t factor in measures besides testing data.
3 Value table
Twelve states use a value table, which compares a student’s performance with where he or she stood last year, to see if the student moved up or down. This method is a lot easier for the public to understand because it uses simpler terms — for example, it can say that a student moved from below basic last year to basic this year, based on test scores. However, understanding how well a student is doing depends on how rigorous a state’s performance measures are. This method also cannot indicate how well an individual school is helping a student progress.
4 Gain score
Used by three states, this method compares how well a student performs on comparable tests from year to year. To do this, states translate test scores into “scale scores” for comparison. A state can then say whether a student performed so many points higher or lower than last year. But this method cannot say how well a specific school contributed to student growth.
5 Growth to standard
Ten states are using this method, which looks at whether a student is growing in relationship to grade-level goals. This assumes the rate at which a student grows will continue each year and doesn’t take into account a student’s individual characteristics. Determining how well a student is doing relies on how rigorous the state’s benchmarks are.
Disclosure: The Bill & Melinda Gates Foundation, Carnegie Corporation of New York and the Chan Zuckerberg Initiative provide financial support to Data Quality Campaign and The 74.
Get stories like these delivered straight to your inbox. Sign up for The 74 Newsletter