New Study: 5 Ways Racist 1930s Housing Policies Still Haunt Schools

;)
Untangle Your Mind!
Sign up for our free newsletter and start your day with in-depth reporting on the latest topics in education.
Disparities in education funding, academic performance and school segregation still persist along racist lines drawn in the late 1930s, a new study has found.
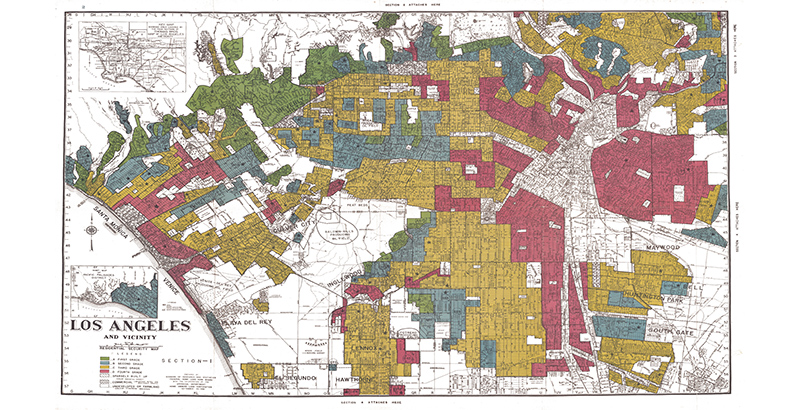
In the aftermath of the Great Depression, the U.S. government mapped out the supposed risk for mortgage lenders in neighborhoods across hundreds of cities — basing their assessments largely on the area’s racial makeup. Zones deemed high-risk, often inhabited by Black, immigrant, and Jewish populations, were coded in red by mapmakers, spurring the policy’s infamous name: redlining.
In their new study, “The Lingering Legacy of Redlining on School Funding, Diversity, and Performance,” released by the Annenberg Institute at Brown University as a working paper, co-authors Christopher Cleveland and Dylan Lukes, both PhD candidates in education policy at Harvard University, became the first scholars to link the New Deal-era practice to current day school outcomes.
Nearly a century later, the disparities remain dramatic.
“The persistence of some of these trends is definitely cause for reflection,” Cleveland told The 74.
Prior scholarship has traced how discriminatory lending practices allowed white families to access home ownership in newly built suburbs, while Black and immigrant families were largely denied loans — explaining part of America’s racial wealth gap. Author Richard Rothstein, who wrote The Color of Law, described the programs as a “state-sponsored system of segregation.”

“The maps are really old, like 1930s, 1940s,” said Cleveland. “That’s a very different time in our country, and so you would not think that these associations would exist.”
But they do. The practice haunts education outcomes to this day, the study found.
“There’s a long history in the United States of racially discriminatory policies and practices,” explained Lukes. “There are things from 90 years ago that relate to modern educational outcomes.”
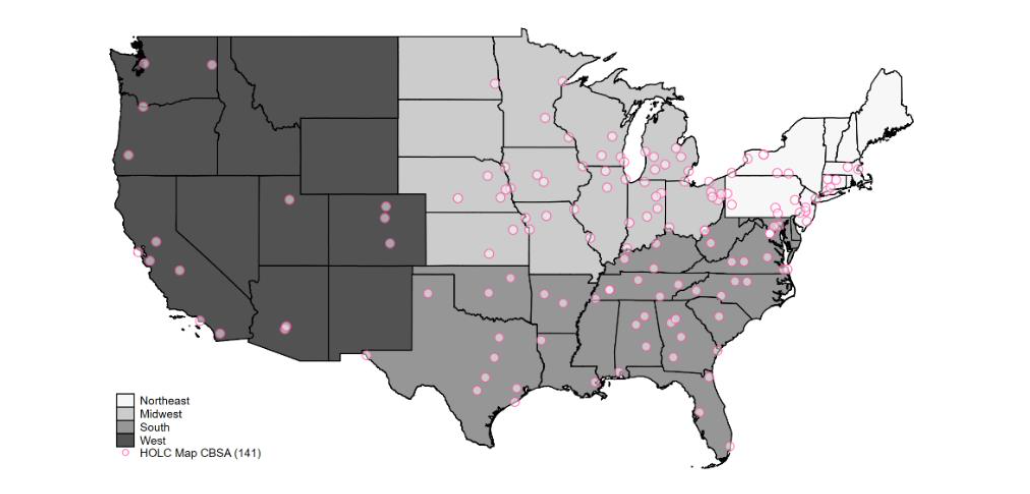
To make the connection, the researchers used mapping software to sync over 10,000 current-day school locations with New Deal-era lending maps from 144 cities in 38 states.
The researchers compared how schools and districts from redlined areas stacked up against schools in neighborhoods that, 80 years ago, mapmakers had viewed more favorably. Here’s what they found:
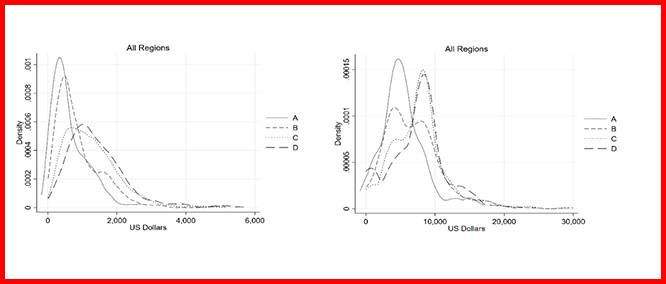
1 Funding gaps top $2,500 per pupil
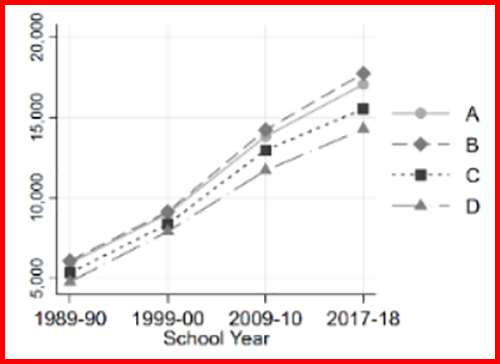
Schools in redlined areas face stark funding disparities compared to schools in areas rated more favorably. On average, they spend nearly $2,500 less per pupil than schools in top-rated zones, and over $3,000 less than schools in neighborhoods rated second-tier.
Differences in home values largely explain that gap. Locally, education revenues come from property taxes. More expensive houses, therefore, translate to more cash for neighborhood schools.
Because better schools can in turn jack up property values, the pattern often becomes cyclical.
Those disparities have been persistent and have even widened over time. Funding gaps were smaller in the late 1980s than in the 2017-18 school year.
2 Redlined schools are more segregated
The study also found schools in redlined areas were less likely to have diverse student bodies, tending instead to have higher percentages of Black, Hispanic and Asian students.
While schools in neighborhoods the New Deal-era lending program rated as more “desirable” averaged more white students, they also tended to have a greater racial mixture in their classrooms.
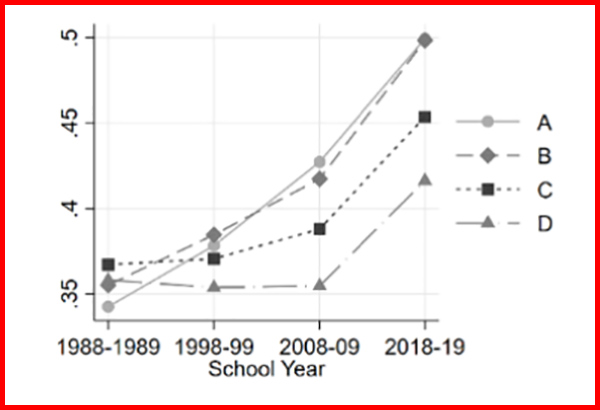
Picking two students at random, it would be 8 percent more likely that the pair would have differing racial identities in schools from top-rated zones versus redlined zones, at 49 percent and 41 percent likelihood respectively, the results showed.
Like funding gaps, differences in school diversity also emerged over time. Schools from green-rated neighborhoods had the least mixed student bodies in the late 1980s and claimed among the highest by 2017-18. While all school types have trended toward increasing levels of diversity in the past three decades, mirroring population-wide trends in the U.S., levels of school segregation have widened by many measures.
“Given the rising importance placed on school diversity in schools and districts across the nation,” the authors write in the paper, “it is perhaps unsurprising that those districts and schools with the most available resources … also have the most diverse student populations.”
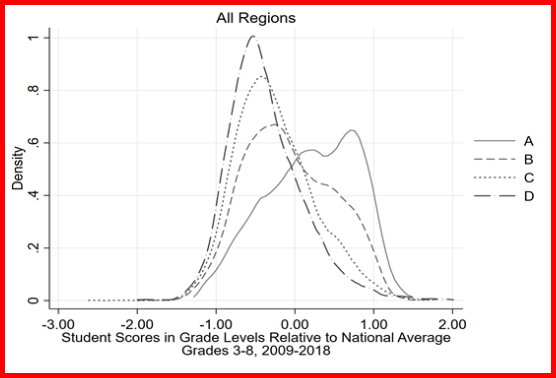
3 Achievement gaps persist
Perhaps unsurprisingly, achievement gaps have accompanied funding and diversity disparities.
“We saw pretty stark differences” in test results, said Lukes.
“The average is lower for [redlined] schools,” added Cleveland.
While numbers do not go as far back for standardized test data as it did for funding and student demographics, the researchers analyzed year-to-year learning rates to estimate whether schools from redlined areas were making up ground. Rates were even across groups, they found, meaning that gaps appear set to stay in place.
4 Federal and state funds can help
Though funding gaps between schools in redlined versus non-redlined areas have remained persistent, money from the federal and state levels has helped make up some of that ground.
Because of state funding formulas and federal programs like Title I, redlined schools tend to receive more federal and state money than schools in other zones.
The stark gap in local education revenues is “offset by federal and state [dollars],” which target underfunded districts, explained Lukes. “But not enough to overcome differences.”
5 Policymakers must account for historical disparities
In the face of a historical policy like redlining, Cleveland believes decision makers should consider, “What is an equally intentional response that can undo those mechanisms?”
Re-examining the relationship between school funding and property taxes may be a place to start.
“There might be a chance to separate housing from (education) funding, in recognizing that certain schools are located in places where it’ll take a long time for them to get additional dollars” through local taxes, Lukes told The 74.
The bottom line, the paper concludes, is “education policymakers need to consider the historical implications of past neighborhood inequality on present-day neighborhoods when designing and implementing … interventions that target inequitable outcomes.”
Get stories like these delivered straight to your inbox. Sign up for The 74 Newsletter
Asher Lehrer-Small is a former staff reporter at The 74. He is currently a K-12 education reporter for the Houston Landing.