Which Teaching Jobs Are Easier or Harder to Staff? New Data Has Some Answers
Aldeman: Analysis of what happened in Washington state over the course of 2022 shows the nuances in the teacher shortage storyline.


;)
Untangle Your Mind!
Sign up for our free newsletter and start your day with in-depth reporting on the latest topics in education.
Get stories like this delivered straight to your inbox. Sign up for The 74 Newsletter
What do real-time job-openings data reveal about teacher hiring and shortages?
Dan Goldhaber and a team of researchers at the University of Washington wanted to find out. They scraped public job postings from school district websites across the state of Washington, and compared the number of openings against the number of people working in those roles in the prior year. By adding this denominator, they were able to determine which teaching positions were comparatively easier or harder to staff. Their latest working paper focuses on what happened over the course of 2022.
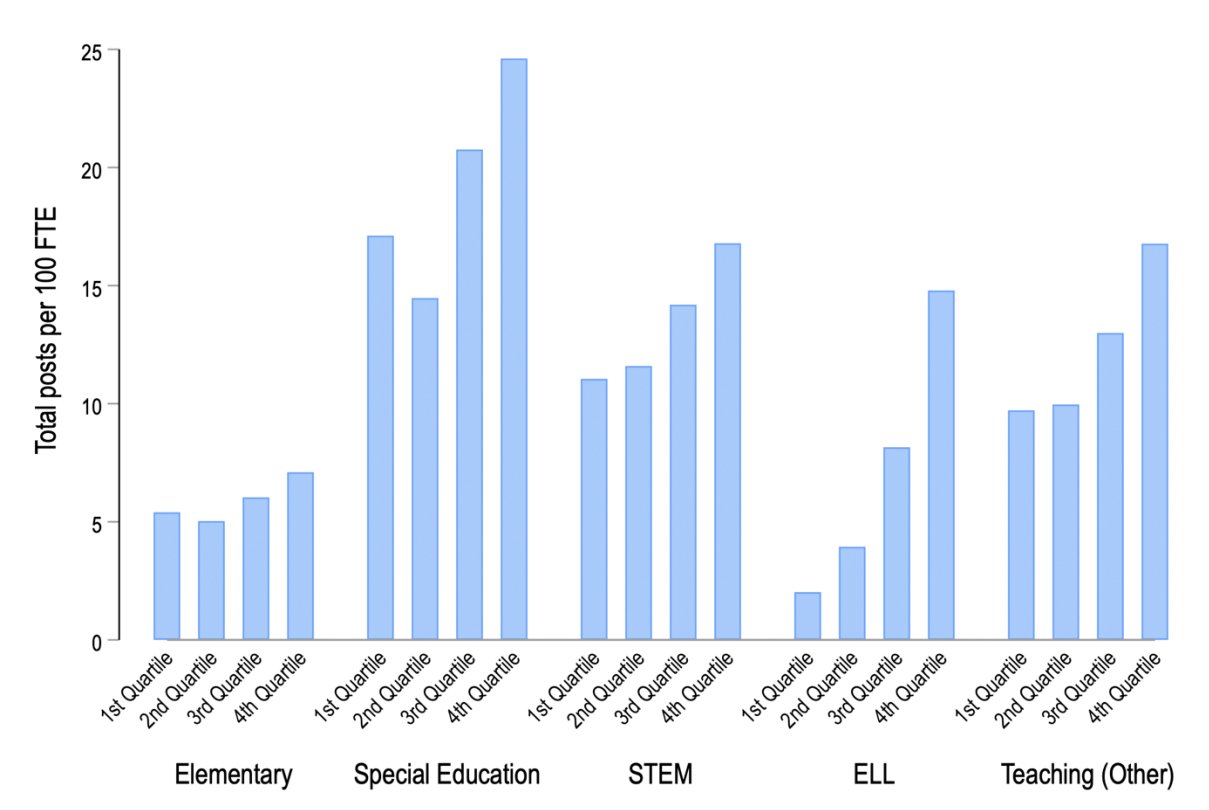
They find that while there are a lot of elementary teachers overall, there are proportionally few openings for those jobs.
In contrast, there were many more special education, STEM and English learner teaching positions, and these were much harder to fill. Proportionally speaking, there were about 3 to 5 times as many open teaching jobs with a focus on special education, STEM and English Language Learners. There were large disparities across schools in terms of how many people they wanted to hire.
The first graph below shows the number of job openings per 100 full-time employees, sorted by subject area and school type. The lines are scaled based on how many people were working in those roles in the prior year. Schools are sorted into quartiles based on how many underrepresented minority students they serve.
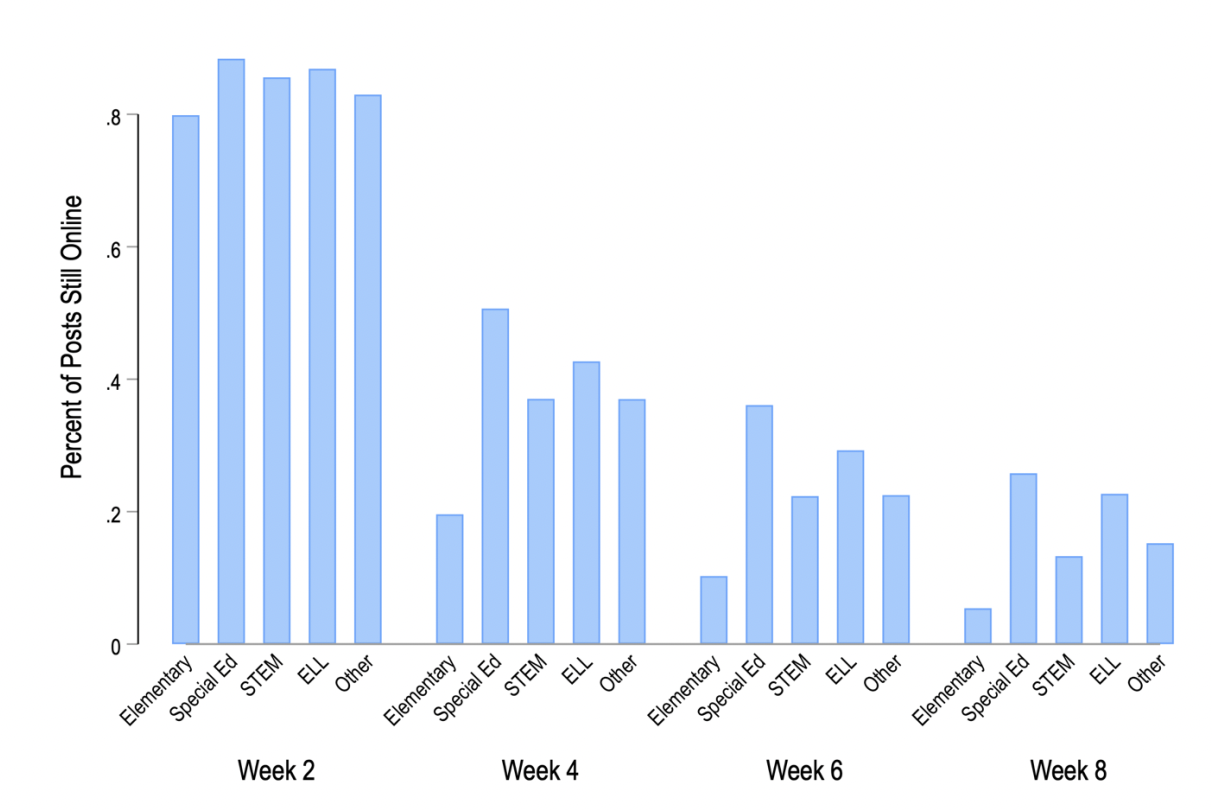
Goldhaber’s team also looked at how long the jobs stayed open. The graph below shows the percentage of jobs that remained unfilled at various points in time.
Again, there were large differences across subject areas. About 60% of elementary teaching jobs were removed within four weeks of posting. As the authors write, “elementary education-credentialed job candidates are relatively plentiful, making elementary positions relatively easy to fill.” In comparison, it took longer to fill the open teaching jobs for special ed, STEM and English learners — if they got filled at all.
While these findings may not be new, the data are. And they have lessons for future teaching candidates and for policymakers seeking solutions.
For prospective teachers, the lesson is clear: If they want to find a job, they will have a much easier time if they earn their license in a shortage area.
This confirms prior work. When Melissa Steel King, Leslie Kan and I looked at older data for Illinois in 2016, we found that the state produced 12.4 social studies teachers for every new hire. In contrast, the ratio was just 1.5 to 1 in special education. In Vermont, Kieran Killeen, Susanna Loeb and Imeh Williams found an average of 38 applications for each social studies job opening, compared with an average of 12 for special education, science and math. Goldhaber has found similar results in Washington for hiring differences by subject area, especially during times with competitive labor markets.
From the employer’s side, NCES data show that the subject areas with the worst shortages a decade ago are largely still the worst today. What’s changed is that the labor market has tightened and made all hiring tougher. Private schools are suffering the same labor market challenges as public schools, which implies the problem is related more to broader economic factors rather than to anything unique to schools or the public sector.
It’s become harder for principals to find teaching staff across all subject areas, but some headline writers have erroneously translated this into a broad, generic story. The shortages are not equal and never have been. As even national survey data show, it’s about 2 to 3 times harder to fill foreign language, special education and STEM teaching positions than it is to find general elementary or social studies teachers.
To find out what the numbers look like in their communities, state leaders can take a look at their shortage areas and see what is cyclical versus what is consistent. They could also look at their pipeline of teacher candidates by subject area to forecast future shortages. Cyclical shortages call for a fast, temporary response, while persistent shortage areas — like STEM and special ed — may call for a long-term, durable and statewide response.
The data on teacher shortages tell a nuanced story. The media, potential teaching candidates and policymakers all need to diagnose the problems accurately and then use the data to respond accordingly.
Get stories like these delivered straight to your inbox. Sign up for The 74 Newsletter
Chad Aldeman is a regular columnist for The 74. He writes about school finance, state assessments and accountability, and the teacher labor market. He is also the founder of Read Not Guess, a program to help parents teach their children to read
@ChadAldeman