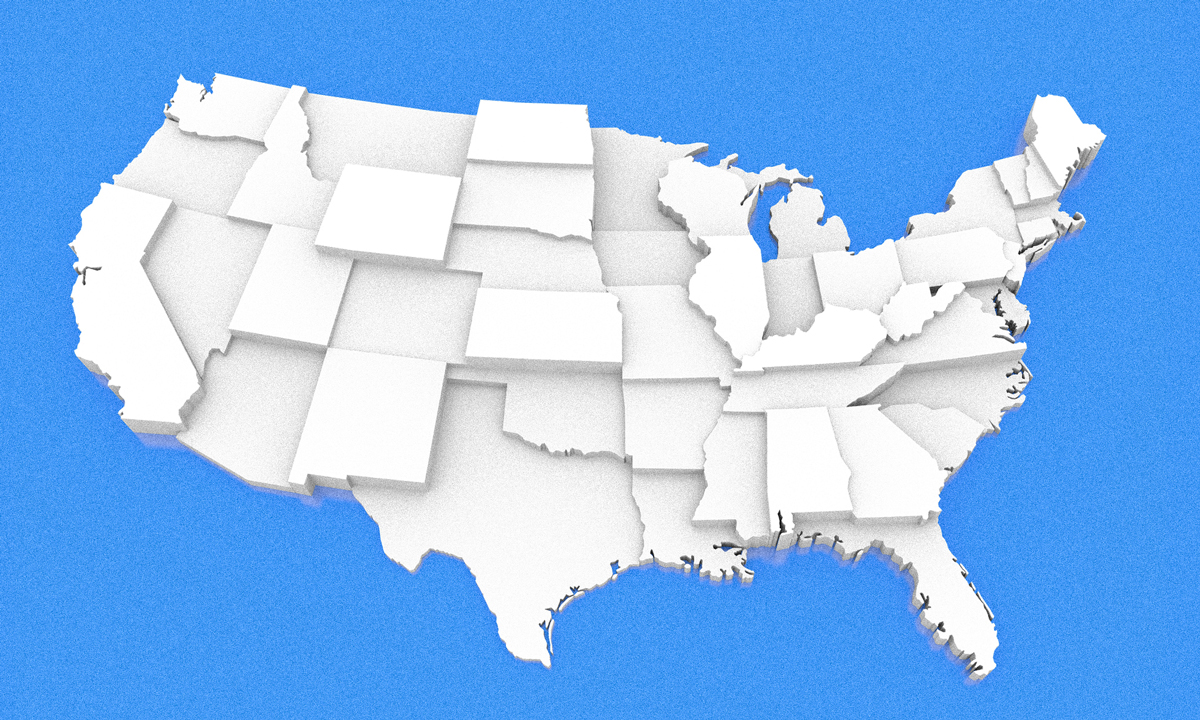
The 50 Very Different States of American Public Education
Aldeman: From per-pupil spending to teacher credentials, what would look weird to people in New York may be standard practice in Florida or Arizona.

;)
Untangle Your Mind!
Sign up for our free newsletter and start your day with in-depth reporting on the latest topics in education.
Get stories like this delivered straight to your inbox. Sign up for The 74 Newsletter
There is not one American public education system; the U.S. is a collection of 50 states, and those states have chosen to deliver public education using very different approaches.
These choices manifest themselves in a variety of ways, including how much money states provide for their public schools, how many people work in those schools and in what types of roles, and how teachers are recruited and trained. Here are five big differences:
1. Per-pupil spending
At the national level, public schools spent an average of $15,810 per pupil in 2019-20, not including debt or construction costs. But that figure hides tremendous variation across the country. Idaho and Utah schools, for instance, spent less than $10,000 per pupil, whereas Vermont; Washington, D.C., and New York schools spent upward of $25,000 per student.
In real, inflation-adjusted terms, school spending nationally is 6% higher than it was a decade ago, and it’s up 28% over the last two decades. The gap between states is also growing over time. Over the last 20 years, the 10 lowest-spending states have increased their school funding by 16%, while the top-spending states have boosted theirs by 48%.
These figures are not adjusted for cost-of-living differences, and it is clearly cheaper to live in Boise than in New York City. But other decisions are driving these spending differences as well.
2. Student-to-teacher ratios
According to the most recent data, Vermont has the lowest student-to-teacher ratio in the country, at 10.5 students for every teacher. Maine, D.C., New Hampshire, New Jersey and New York were all under 12 to 1. The data are in terms of full-time equivalent employees, or FTEs, which account for the number of hours an employee actually works.
In contrast, states in the South and West tend to have far more students per teacher. Oregon, Idaho, Louisiana, Florida, Alaska and Washington are all clustered together at just under 18 to 1. Alabama comes next, at 19 to 1, followed by California, Arizona and Utah at over 22 students per teacher.
To put it another way, in per-student terms, Vermont public schools employ more than twice as many teachers as California, Arizona or Utah schools do.
3. Total staffing levels
Nationally, teachers make up just under half of all public school employees. But that ranges from 31% in Ohio up to 60% in Idaho. That is, Idaho’s investments in education are more likely to go to teachers, whereas Ohio’s are more likely to go to other types of staff.
As with teachers, Vermont has the lowest student-to-staff ratio, with just 4.5 students for every full-time equivalent staff member. Maine, Connecticut, D.C., Ohio and New Hampshire are all below 5.5 students per school employee. Some of these states are among the most expensive places to live, but their staffing choices also make their schools more expensive.
On the other end, some states operate with much leaner staffing models. For example, public schools in Alabama, Arizona, Idaho and Washington schools all have 10 to 12 students per staff member. In other words, the typical public school in some states employs about half the staff as is common in other states.
4. Teacher preparation programs
States also get their teachers through very different pathways. According to the 2020-21 National Teacher and Principal Survey, about 30% of educators in their first three years in the classroom came through an alternative certification program.
Midwestern and Northeastern states tend to rely less on alternative routes and more heavily on traditional training. Among states with reliable data, Illinois, Massachusetts, Oregon, Michigan, Connecticut and Kansas all have less than 20% of their new teachers coming through alternative programs.
On the higher end, more than half of all new teachers enter through nontraditional routes in Florida and Texas. New Mexico topped the list, with nearly two-thirds of all new teachers entering teaching in this way. These states may be making pragmatic decisions about local supply and demand, but relying more heavily on alternative programs also improves teacher diversity and likely lowers debt for teachers, while it may come at the cost of higher turnover.
5. Teacher credentials
Teachers are very well educated, and more than 60% have earned a master’s degree or higher by their third year in the profession (compared with only 14% of all American adults).
But those national trends mask wide variation across the states. Only 30% to 40% of teachers in Oklahoma, Texas, Louisiana and South Dakota have earned a master’s, versus 87% in Massachusetts, 91% in Connecticut and 96% in New York.
In other words, the teaching profession looks very different depending on which state you happen to live in. What might appear weird to people in New York or Massachusetts may be standard practice for teachers, educators and schools in Florida or Arizona. As schools across the country work to re-engage students and get them back on track academically, it’s worth learning from these differences and understanding what can be ignored versus might be worth replicating.
Get stories like these delivered straight to your inbox. Sign up for The 74 Newsletter
Chad Aldeman is a regular columnist for The 74. He writes about school finance, state assessments and accountability, and the teacher labor market. He is also the founder of Read Not Guess, a program to help parents teach their children to read
@ChadAldeman