Schneider: The New PISA Scores Tell Us Lots About the Sad State of American Education. What They Can’t Tell Us Is How to Fix It

;)
Untangle Your Mind!
Sign up for our free newsletter and start your day with in-depth reporting on the latest topics in education.
The newest reading and math results from the Programme for the International Assessment of Student Achievement (PISA) are out … and no matter how you look at them, they are disappointing for the United States. The Dec. 3 release includes results from all 37 Organisation for Economic Co-operation and Development countries and 42 other jurisdictions around the globe. Not surprisingly, the national average scores — and the country rankings based on them — will be generating a lot of hoopla.
Global PISA data can provide important insight into the condition of American education. But those same data can also be used to justify specious advice on policy and practice. From where I sit at the U.S. Department of Education’s Institute of Education Sciences, here’s what you need to know when you crack open PISA 2018.
First, and not surprisingly, PISA data mirror patterns found in the recently released National Assessment of Educational Progress (NAEP) scores. But the global PISA data add another dimension to our own national assessment data. Here, I focus on reading and math because the most recent NAEP science data are not yet published.
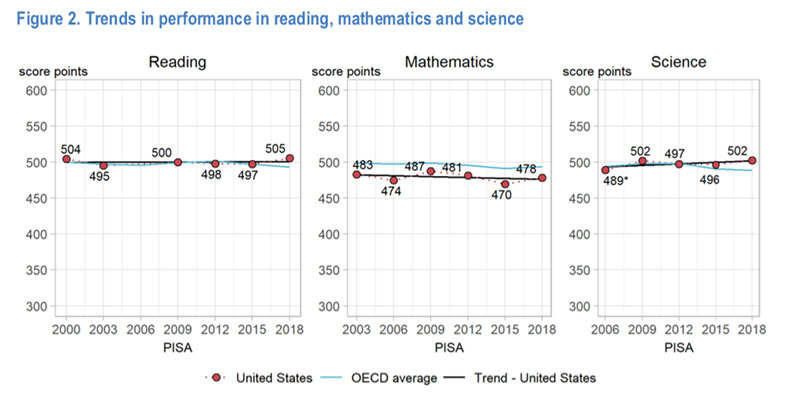
Reading
U.S. students overall are doing OK on reading. Depending on how you count countries that are not statistically different than the U.S., our students ranked ninth in the world. However, before breaking out the champagne, there are several patterns in the data that should give the U.S. pause.
First, the scores have not changed at all since 2000, when PISA was first administered. American students scored 504 in reading in 2000 and 505 in 2018. That’s almost two decades of no progress, despite billions upon billions of dollars spent on our schools and years upon years of education reform.
Second, the U.S. moved up from 15th in 2015 not because our students have gotten better — it’s that scores in many other countries that were ahead of the U.S. in 2015 have fallen. Scores in Belgium, Switzerland, France, the Russian Federation, Portugal and the Netherlands were all statistically identical to those in the U.S. in 2015 but are now lower. Another group of countries — Korea, Poland, New Zealand, Japan, Norway and Germany — scored higher than the U.S. in 2015 but were statistically the same as us in 2018. Bottom line: We stood still, but other countries lost ground. Not the best way to gain in a rankings table.
PISA data reflect what NAEP also showed: There is a large and persistent gap between the top and bottom of reading performers. In 2000, our readers at the 10th percentile scored 363 on PISA, while readers at the 90th percentile scored 636 (a 273-point gap). In 2018, the score for 10th-percentile readers was 361, and at the 90th percentile it was 643. The gap now stands at 282 points. Since PISA scales have a standard deviation of 100 points, there is a gap of almost 3 standard deviations between the top and bottom readers in the nation — a huge difference that persists.
Math
If we squint hard enough, we can see some (sort of) good news in the reading data. The math data are a uniform disaster.
The U.S. score of 478 was 11 points lower than the OECD average, placing us 31st in the world (including statistical ties). Our overall PISA math score hasn’t changed a bit since 2003, paralleling the stagnation of math scores in NAEP.
But averages can hide as much information as they convey. The real warning sign in the PISA data is just how few American students make it into the highest levels of math literacy.
PISA divides student performance into six levels, with 5 and 6 being the highest. Only 8 percent of American 15-year-olds make it into those two levels. This is below the OECD average of 11 percent and far below the percentage of high performers in 30 other educational systems. In contrast, over one-quarter of American 15-year-olds score at the very lowest level of PISA math proficiency.
The comparative data show how the international scope of PISA adds another dimension to the far more robust NAEP data. Together, there are enough indicators in NAEP and PISA to show that the U.S. education system is not doing its job. The lagging attainment of our lowest-performing students, our at-best mediocre and flat scores in almost every national and international assessment, and the growing expenditures at all levels of government on a stagnant education system all point to fundamental problems.
PISA provides valuable data about the performance of U.S. students relative to those in many other countries and jurisdictions around the world. However, OECD’s attempts to provide policy advice based on correlational data and, in some jurisdictions, student samples that are not representative of the full range of variation in performance or background characteristics, is ill-considered, a waste of resources and damaging to efforts to improve student achievement. Rather, the U.S. would be better off focusing on the strong science we have about reading and making sure that literacy instruction is based on that science. And we would be better off continuing to build on the growing evidence of what works in math education. The Institute of Education Sciences is committed to generating strong evidence to help schools and policymakers find what works for whom under what conditions. Unfortunately, that is a long, hard slog compared to facile advice based on weak evidence characteristic of PISA.
Mark Schneider is director of the Institute of Education Sciences at the United States Department of Education. Before assuming that role, he was a vice president and Institute Fellow at the American Institutes for Research and the president of College Measures. He previously served as the U.S. commissioner of education statistics from 2005 to 2008 and is a distinguished professor emeritus of political science at the State University of New York, Stony Brook.
Get stories like these delivered straight to your inbox. Sign up for The 74 Newsletter