Nation’s Report Card Shows Largest Drops Ever Recorded in 4th and 8th Grade Math
The education world has waited nervously for the first NAEP release since COVID. Scores show evidence of severe learning loss, especially in math

Get stories like this delivered straight to your inbox. Sign up for The 74 Newsletter
National testing data released this morning reveals severe damage inflicted on student math and reading performance, reaffirming COVID-19’s ongoing educational toll. Even as some states have shown evidence of academic recovery this year, federal officials cautioned that learning lost to the pandemic will not be easily restored.
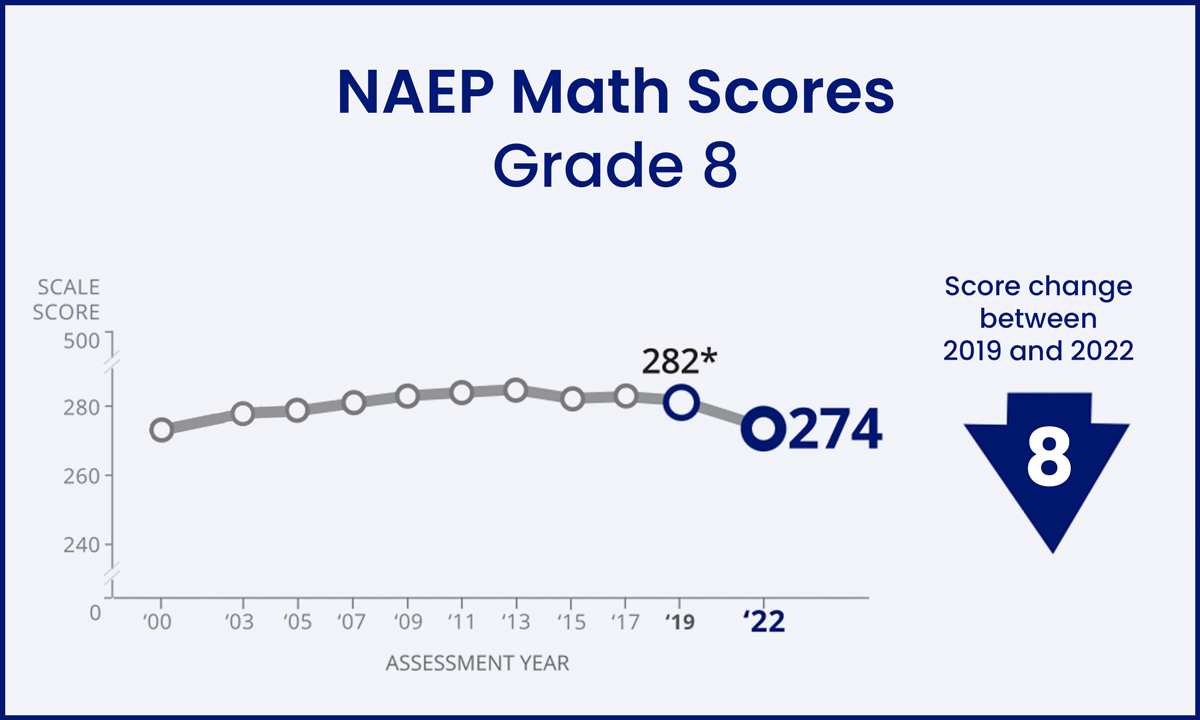
Eighth-grade math scores on the National Assessment of Educational Progress, often called the “Nation’s Report Card,” fell by a jarring eight points since the test was last administered in 2019, while fourth-grade scores dropped by five points; both are the largest math declines ever recorded on the test. In reading, both fourth- and eighth-grade scores fell by three points, leaving them statistically unchanged since 1992, when NAEP was first rolled out.
The findings comport with those of previous assessments of students’ COVID-era achievement, whether conducted by academic researchers or state and district authorities, which have shown undeniable evidence of diminished performance in English and especially math. Just a few months ago, the release of scores for 9-year-olds on NAEP’s “Long-Term Trends” assessment — a different exam measuring today’s students against a baseline set in the early 1970s — offered similarly ominous results.
Even still, the education world has waited nervously for the unveiling of today’s data, perhaps the most important federal scores to appear since the pandemic began. Peggy Carr, commissioner of the National Center for Education Statistics, said that while relative stability in reading scores across some of the nation’s largest districts offered a few “bright spots … amidst all the chaos of the pandemic,” the unprecedented reversals in math should spark serious concern.
“Normally for a NAEP assessment … we’re talking about significant differences of two or three points,” Carr said on a Friday call with reporters. “So an eight-point decline that we’re seeing in the math data is stark. It is troubling. It is significant.”
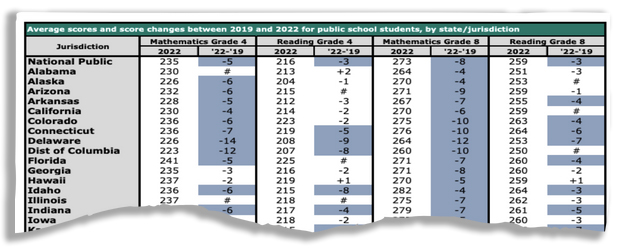
A look at the results in their entirety show just how significant. There were no statistically significant gains in math, for either fourth or eighth graders, in any state in 2022. Instead, fourth-grade scores dropped significantly in 43 jurisdictions (either the 50 states, the District of Columbia, or schools operated by the Department of Defense Education Activity) while remaining statistically unchanged in 10. Eighth-grade math fell in 51 jurisdictions while holding steady in just two, Utah and the DoDEA schools. The average eighth-grade score has not only fallen since 2019 — it is significantly lower than when the test was administered in 2003.
Translated into the exam’s performance levels, a massive downward shift can be seen. In 2019, 34% of fourth graders and 27% of eighth graders scored below the “NAEP Basic” level in reading — the most rudimentary threshold of English mastery classified by the test. In 2022, those groups had grown to 37% of fourth graders and 30% of eighth graders, respectively. The below-basic classification also swelled in math, from 19% of fourth graders and 31% of eighth graders in 2019 to 25% of fourth graders and 38% of eighth graders in 2022.
Beneath the headline numbers, differing effects among student groups also made an impact on longstanding achievement gaps. For example, gaps expanded in fourth-grade math performance between white and African-American students, white and Hispanic students, male and female students, and students with and without disabilities. Conversely, gaps actually closed between many of the same groups in eighth-grade reading — including by a surprising seven points between English learners and native English speakers.

Brown University economist Emily Oster, who has studied the effects of COVID and remote learning on student achievement, said that trends in NAEP scores were dynamic and varied, making them difficult to distill. Big-picture phenomena, however, broadly lined up with the existing evidence, she argued.
“Every state has four numbers, so one can construct quite a lot of different narratives around that. But the general patterns are that the losses are big, they’re much bigger in math than in reading, and they’re much bigger in more vulnerable kids. Those seem like things that are very consistent with every other piece of information that we’ve seen in post-pandemic testing.”
Julia Rafal-Baer is a K-12 education expert who serves on the National Assessment Governing Board, a nonpartisan body that sets policy for NAEP. In a statement, she said the results demonstrated the existence of “an education crisis” that demanded new solutions.
“The latest data isn’t telling us anything we didn’t already know,” Rafal-Baer wrote in an email. “COVID was exceptionally disruptive, and we’re running out of time to ensure that kids can indeed recover from this level of unfinished learning.”
State-by-state comparisons difficult
No state could be said to have defied the downward pressure exerted by the pandemic and its countless challenges to learning. But the national averages do conceal substantial variation across different areas of the country.
Some of the states where scores dropped the furthest, for example, were clustered in the mid-Atlantic region. Delaware’s fourth-grade math scores dropped an astonishing 14 points — nearly three times the national average — while its losses in fourth-grade reading (-9), eighth-grade math (-12), and eighth-grade reading (-7) were also significant. Virginia (-11 points in fourth-grade math), Maryland (-11 in eighth-grade math), and the District of Columbia (-8 in fourth-grade reading) also saw some of the worst declines across various grade/subject combinations.

By contrast, a small group of states seemed to weather COVID reasonably well, experiencing less severe declines than most. Overall, while performance in eighth-grade math was weakened virtually everywhere, 10 jurisdictions, including Georgia and Wisconsin, saw no statistically significant decline in fourth-grade math. Another 22 were able to stave off declines in fourth-grade reading, while 18 did so in eighth-grade reading.
A small number of states — Alabama, Hawaii, Illinois, Iowa and Louisiana — kept scores from significantly falling in three out of four grade/subject combinations. Most impressive of all, Department of Defense Education Activity schools — 160 across 11 foreign countries, seven states, and two territories, each serving military families — saw no statistically significant drops in any subject or age group. Eighth graders in DoDEA schools, in fact, made the only statistically significant growth of any student group in this round of NAEP, improving in reading by two points since 2019.
The differences between states will naturally raise questions about the procedures they followed to offer schooling during the pandemic. Among the states that saw the largest score declines, many stuck with remote learning far into the 2020-21 school year as a precaution against COVID spread.
Oster, whose previous research has found that longer periods of remote instruction were linked with more severe learning loss, called the results “very consistent with what we’ve seen in state-level data, which suggests that places that had the most in-person learning lost less than the places that had more virtual learning.” Even so, she added, a state like California — where she would have expected student scores to fall especially dramatically based on that correlation — instead saw more modest declines.
NCES’s Carr argued that the release provided little scope for comparisons between states, since so many jurisdictions experienced “massive, comprehensive declines.”
“There’s nothing in this data that says we can draw a straight line between the time spent in remote learning, in and of itself, and student achievement,” she said. “Let’s not forget that remote learning looked very different across the United States — the quality, all the factors that were associated with implementing remote learning. It is extremely complex.”
Megan Kuhfeld, a researcher at the nonprofit testing organization NWEA, said that the average NAEP effects dovetailed with her own expectations based on previous research studies of post-pandemic learning loss. That said, she agreed with Carr that the huge diversity of COVID learning policies — where neighboring school districts sometimes took radically different approaches — made direct comparisons difficult.
“Prior research has supported the idea that remote instruction was a primary driver of widening achievement gaps, but I think it is harder to make that sort of inference at the state level because district reopening policies often varied widely within states,” Kuhfeld wrote in an email.
Urban districts fared better in reading
If a silver lining exists within the release, it comes from some of America’s biggest cities.
In addition to all 50 states and Washington, D.C., 26 urban school districts around the country participate in NAEP’s Trial Urban District Assessment program. The measure offers a unique look inside districts that collectively enroll millions of students and were subject to substantially different state-level public health policies.
Disappointingly, math results in these districts were no better than elsewhere: Fourth-grade and eighth-grade scores alike sank by eight points on average, matching or surpassing the declines for the nation as a whole.
Performance in English, however, offered somewhat sunnier news: Average scores in reading held up in 17 cities, falling in just nine. Fully 21 of the 26 urban districts managed the same in eighth-grade reading, with only Shelby County, Tennessee; Jefferson County, Kentucky; Guilford County, North Carolina; and Cleveland, Ohio, experiencing statistically significant drops. In Los Angeles, the nation’s second-largest district, eighth-grade reading performance even improved.
Michael Petrilli, who leads reform-oriented Thomas B. Fordham Institute, nevertheless took a dark view of the overall NAEP outcomes.
“There’s no sugar coating these awful results,” Petrilli said. “Save for Los Angeles (which I honestly cannot explain), the only question is whether states and localities did bad or worse. These data tell us how big a hole we’ve dug for ourselves. Now it’s up to all of us to dig ourselves — and our students — out.”

Others took a somewhat more hopeful outlook. Tom Loveless, a longtime education researcher who formerly led the Brookings Institution’s Brown Center on Education Policy, said the urban districts’ results provided “a glimmer of hope in these otherwise dismal data.” Moreover, he added, both the NAEP data and state standardized test scores have already shown evidence that student achievement is bouncing back from its pandemic nadir.
Going forward, Loveless observed, state and school district leaders will likely view this round of scores as a kind of new student performance baseline. That could provide an accountability mechanism if things don’t improve.
“I think 2021 was probably the bottom, and we’re getting little shards of progress in these NAEP data,” he said. “But I’m expecting [the 2024 NAEP results] to look quite a bit better, and the state tests, too. If they don’t, I think people will start raising harsh questions.”
Get stories like these delivered straight to your inbox. Sign up for The 74 Newsletter

;)
