NAEP Scores ‘Flashing Red’ After a Lost Generation of Learning for 13-Year-Olds
‘Nation’s Report Card’ shows math skills reset to the level of the 1990s, while struggling readers are scoring lower than they did in 1971

;)
Untangle Your Mind!
Sign up for our free newsletter and start your day with in-depth reporting on the latest topics in education.
Get stories like this delivered straight to your inbox. Sign up for The 74 Newsletter
COVID-19’s cataclysmic impact on K–12 education, coming on the heels of a decade of stagnation in schools, has yielded a lost generation of growth for adolescents, new federal data reveal.
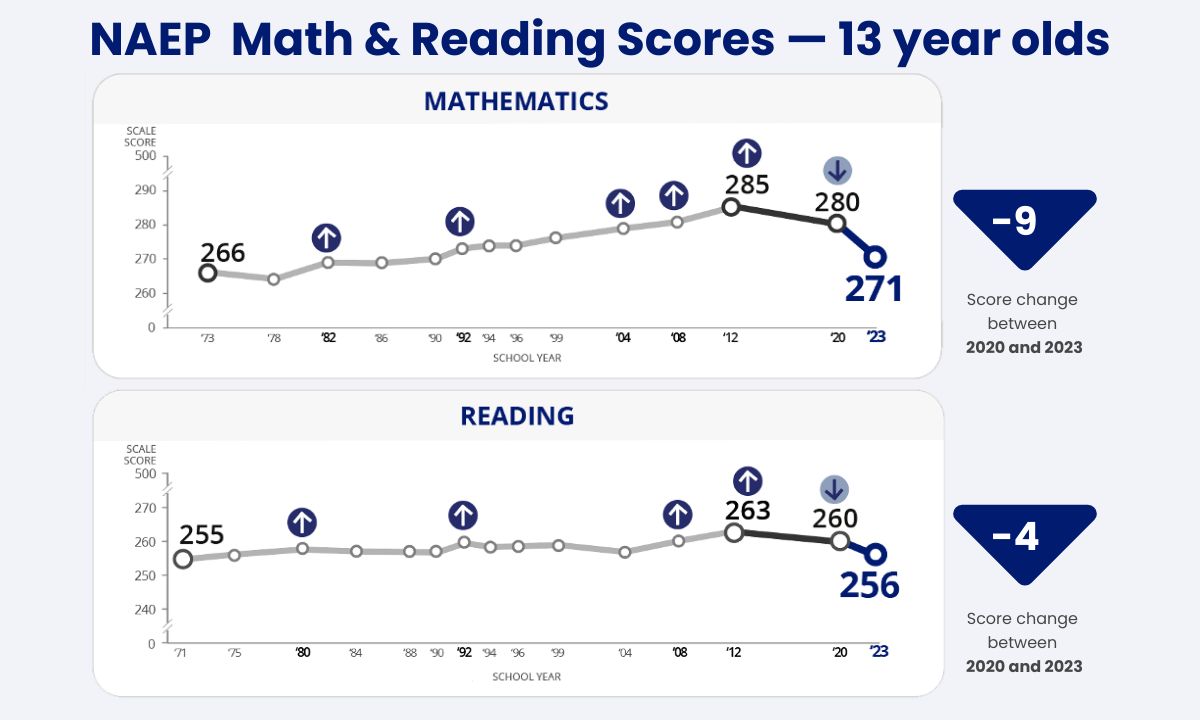
Wednesday’s publication of scores from the National Assessment of Educational Progress (NAEP) — America’s most prominent benchmark of learning, typically referred to as the Nation’s Report Card — shows the average 13-year-old’s understanding of math plummeting back to levels last seen in the 1990s; struggling readers scored lower than they did in 1971, when the test was first administered. Gaps in performance between children of different backgrounds, already huge during the Bush and Obama presidencies, have stretched to still-greater magnitudes.
The bad tidings are, in a sense, predictable: Beginning in 2022, successive updates from NAEP have laid bare the consequences of prolonged school closures and spottily delivered virtual instruction. Only last month, disappointing results on the exam’s history and civics component led to a fresh round of headlines about the pandemic’s ugly hangover.
But the latest release, highlighting “long-term trends” that extend back to the 1970s, widens the aperture on the nation’s profound academic slump. In doing so, it serves as a complement to the 2020 iteration of the same test, which showed that the math and English skills of 13-year-olds had noticeably eroded even before the emergence of COVID-19.
Those disturbing findings, since aggravated by the greatest disruption in the history of American schools, look all the worse today. Reading scores fell by four points between 2020 and 2023, mirroring similar declines in other NAEP releases since last fall, while math scores math scores tumbled by nine points. But an even greater reversal — seven points in reading, and 13 points in math — can be measured going back to 2012, when long-term scores began to slip.
The results set off yet another chorus of alarm bells among federal officials. Peggy Carr, commissioner of the National Center for Education Statistics, which administers NAEP, told reporters that they “should remind us that this is a huge scale of challenge that faces the nation today.”
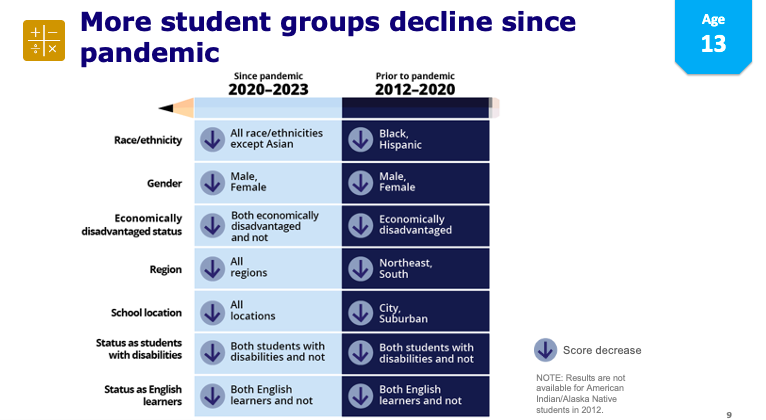
“Certainly the pandemic has made things worse and made things more challenging for us,” Carr said in a media briefing. “But these troubling trends that we’re seeing date back a decade, particularly for our lower-performing students.”
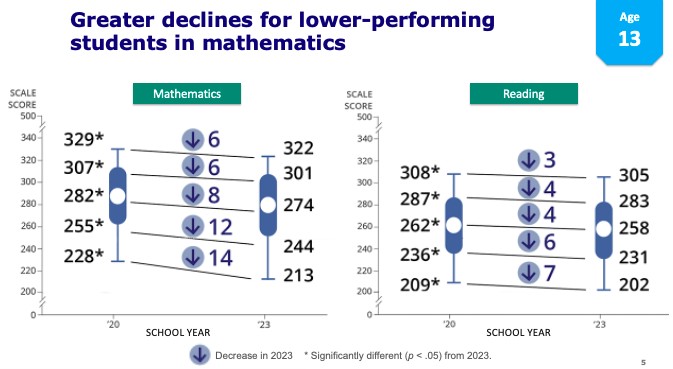
One of the most consistent findings from previous NAEP rounds, echoed in the most recent release, is that students already in need of academic help sustained the worst damage. That phenomenon is displayed most vividly in math: While students at every performance level experienced statistically significant drops in achievement, the fall for those at the top of the heap (minus-six points for those scoring at the 90th percentile of all test takers) was dwarfed by the hit delivered to those at the bottom (minus-14 for those scoring at the 10th percentile).
Again, when compared against the results of a decade ago, the trend becomes even clearer. The drop for top performers stands at seven points since 2012, while the average decline for all 13-year-olds grows to 13 points over that span. But students scoring at the 25th and 10th percentiles have tumbled by a truly stunning margin: 19 and 27 points, respectively.
The long-term trends exam (LTT), which is assessed less frequently than the biannual “main NAEP,” also tests different skills than that test. It measures somewhat simpler material in numeracy, focusing more on basic skills and mathematical definitions than on complex problem-solving, and its content has generally gone unchanged over the last half-century.
Dan Goldhaber, director of the Center for Analysis of Longitudinal Data in Education Research (CALDER) at the American Institutes for Research, said that after a long stretch of progress in the late 20th and early-21st centuries, quantitative measures like the LTT test are now “flashing red.”
“When I talk with lay people about long-term achievement in the country, they tend to think that it’s been really flat over the long term, [but] it’s been trending upward — though arguably too slowly — for much of the last four or five decades,” Goldhaber wrote in an email. “It is amazing how much progress was lost quickly.”
Thirteen-year-olds sit close to a critical pivot point in their K–12 careers. According to NCES, about 60 percent of students sitting for NAEP this year were eighth-graders getting ready for the transition to high school. In last year’s first post-pandemic release of NAEP data, eighth-grade math performance fell notably further than that of fourth graders.
Beyond the divergence between high- and low-scoring participants, already-concerning disparities widened along the lines of race and ethnicity. The gaps in reading and math scores between white and African American students, totalling 23 and 29 points in 2012, grew to 27 and 42 points in 2023. The math gap between white and Hispanic students also grew, from 22 points to 28 points, over the same interval, though the literacy gap between those two groups shrank by four points.
Ancillary survey data, which accompanies raw NAEP scores and provides context about both in-school and out-of-school educational trends, offered additional reason for worry. One facet can be seen in terms of coursework, where the percentage of 13-year-olds reporting that they were enrolled in algebra fell from 34 percent in 2012 to 24 percent in 2023. While 29 percent of respondents said they were taking pre-algebra in 2012, just 22 percent said the same today; at the same time, the proportion of students enrolled in “regular math” rose significantly. Virtually all of that movement occurred between 2012 and 2020, before the onset of COVID.
The drop in algebra enrollment was driven substantially by respondents in the West, where the percentage of algebra students fell from 51 percent to just 19 percent in a little more than a decade. While a shift of that magnitude cannot be attributed to a single origin, California has spent the last few years locked in a debate over whether to delay students from beginning the algebra sequence until the ninth grade.
With respect to literacy, fewer students now report that they read for pleasure than in previous NAEP administrations. Fully 31 percent of respondents said that they “never or hardly ever” read for fun in 2023, compared with just 22 percent who chose that response in 2012. That seldom-reading category is now more than twice as large as the group saying that they read on their own time “almost every day” (14 percent, down from 27 percent in 2012).
Tom Loveless, a longtime education observer who formerly headed the Brookings Institution’s Brown Center for Education Research, said he found the increase disquieting.
“The ability to read has long been a marker of educational status,” Loveless said, also citing similar trends detected by the ongoing Progress in International Reading Literacy Study. “That may be changing, with the perceived value of reading in decline.”
Finally, the release confirms earlier reporting about an ominous and far-ranging increase in student absences from the classroom. One-quarter of participating 13-year-olds said they had missed more than two days of school over the previous month, up from about one-sixth of respondents just three years ago. Meanwhile, the number saying they’d missed 3-4 days rose from 11 percent to 15 percent, and the proportion who said they’d been absent five or more days doubled, from 5 percent to 10 percent.
Frederick Hess, a political scientist who leads education policy studies at the conservative American Enterprise Institute, called the overall results “bleak.” But he declined to speculate whether they might also represent a nadir before a hopeful future rebound, in part because it remained ambiguous which factors were weighing down student achievement the most.
“Part of the problem is we don’t really know what’s driving these scores down, so it’s hard to know if that’s played out or not — or what kind of changes will turn the tide.”
Get stories like these delivered straight to your inbox. Sign up for The 74 Newsletter