Interactive: School Spending Is Up. Teacher Pay Isn’t. See What’s Happening in 8,900 Districts
Aldeman: Teacher salaries have been flat for a long time, lagging behind not only per-pupil spending, but earnings of other college-educated workers
By Chad Aldeman | May 7, 2025
Updated May 21, 2025
School spending is up. So why aren’t teacher salaries?
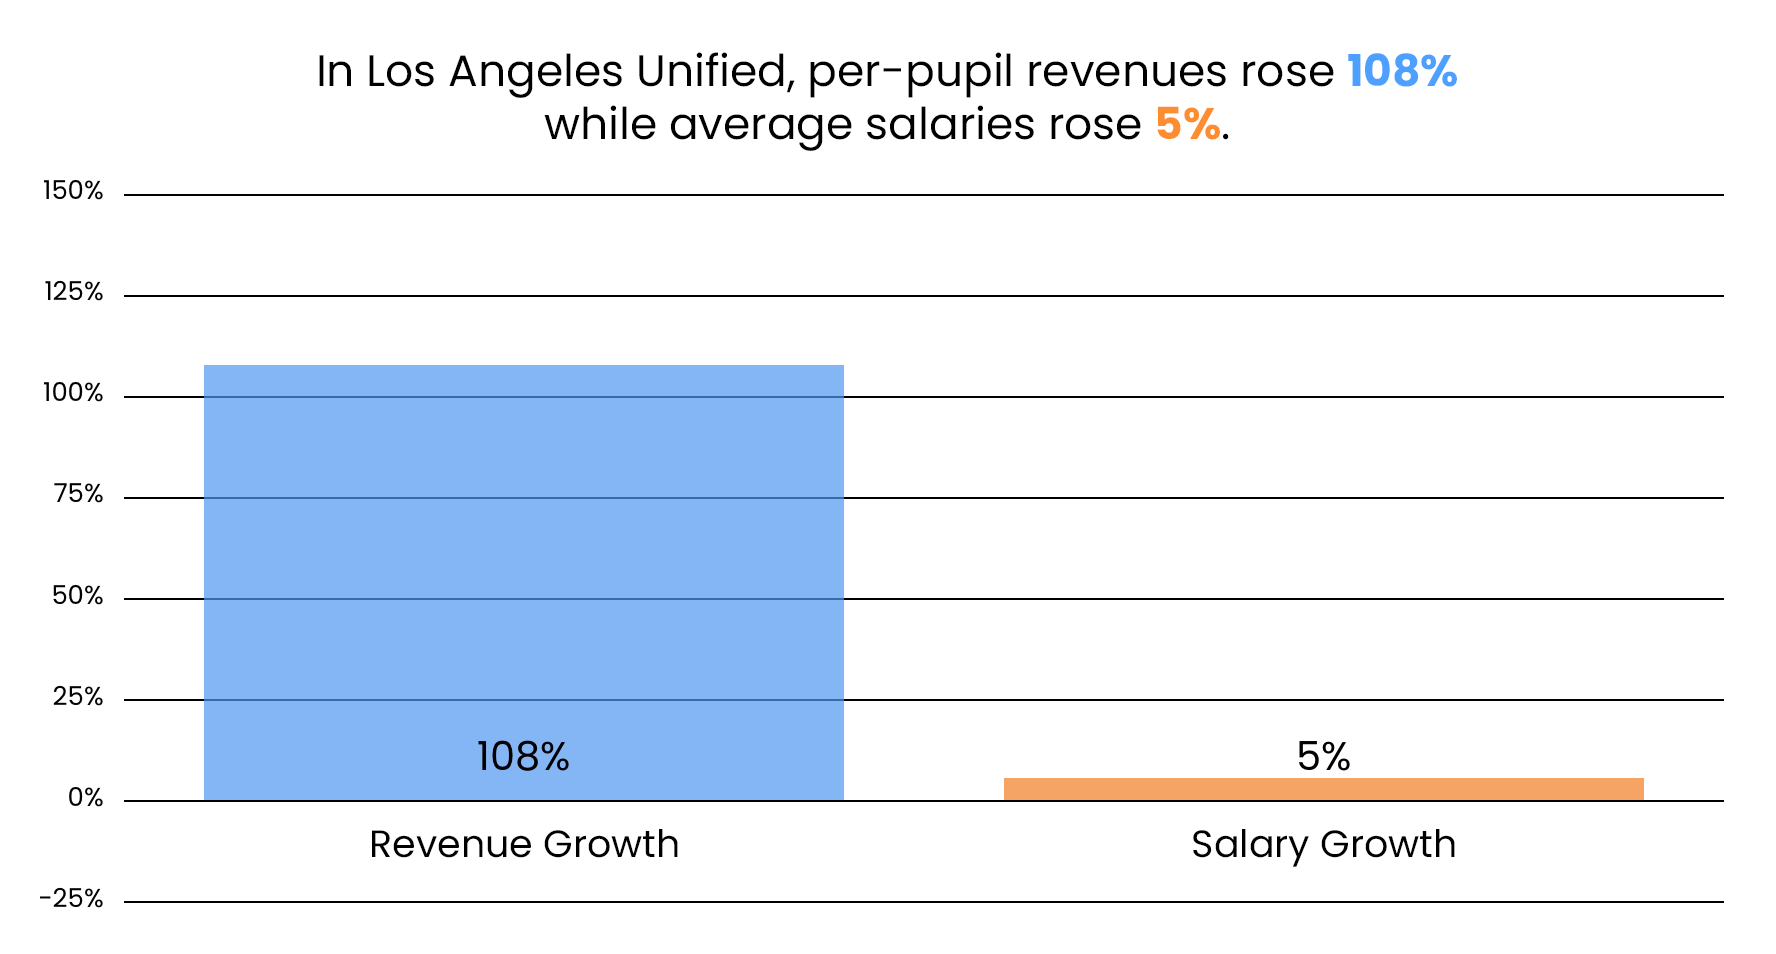
For example, from 2002 to 2022, per-pupil spending in the Los Angeles Unified School District rose 108%. That’s in real terms, after accounting for inflation.
But that money didn’t lead to higher pay. In fact, the average salary earned by district employees rose just 5%.
These trends are not unique to Los Angeles and are, in fact, playing out in most schools and districts across the country.
We set out to document the disconnect between rising school spending and stagnant salary levels.
Nationally, average teacher salaries have been remarkably flat for a very long time. In inflation-adjusted terms, they’ve been hovering around $70,000 for decades.
Meanwhile, pay for other college-educated workers has risen steadily, leaving teachers behind. For example, an analysis last year found the average nurse made less than the average teacher in the 1970s, but nursing pay has risen rapidly since then while teacher salaries have not. Compensation for other professionals, including accountants, engineers, college professors, doctors, health technicians, managers, officials, proprietors, lawyers, judges and scientists, has pulled even farther ahead.
The most obvious explanation for stagnant teacher salaries would be if total education spending were flat. But that’s not it, because America is investing more in schools.
The graph below compares the growth in school spending versus employee salaries for the last two decades. Both figures are adjusted for inflation. But, while spending rose 31% per student, the average salary paid to district employees fell by 2.5%.
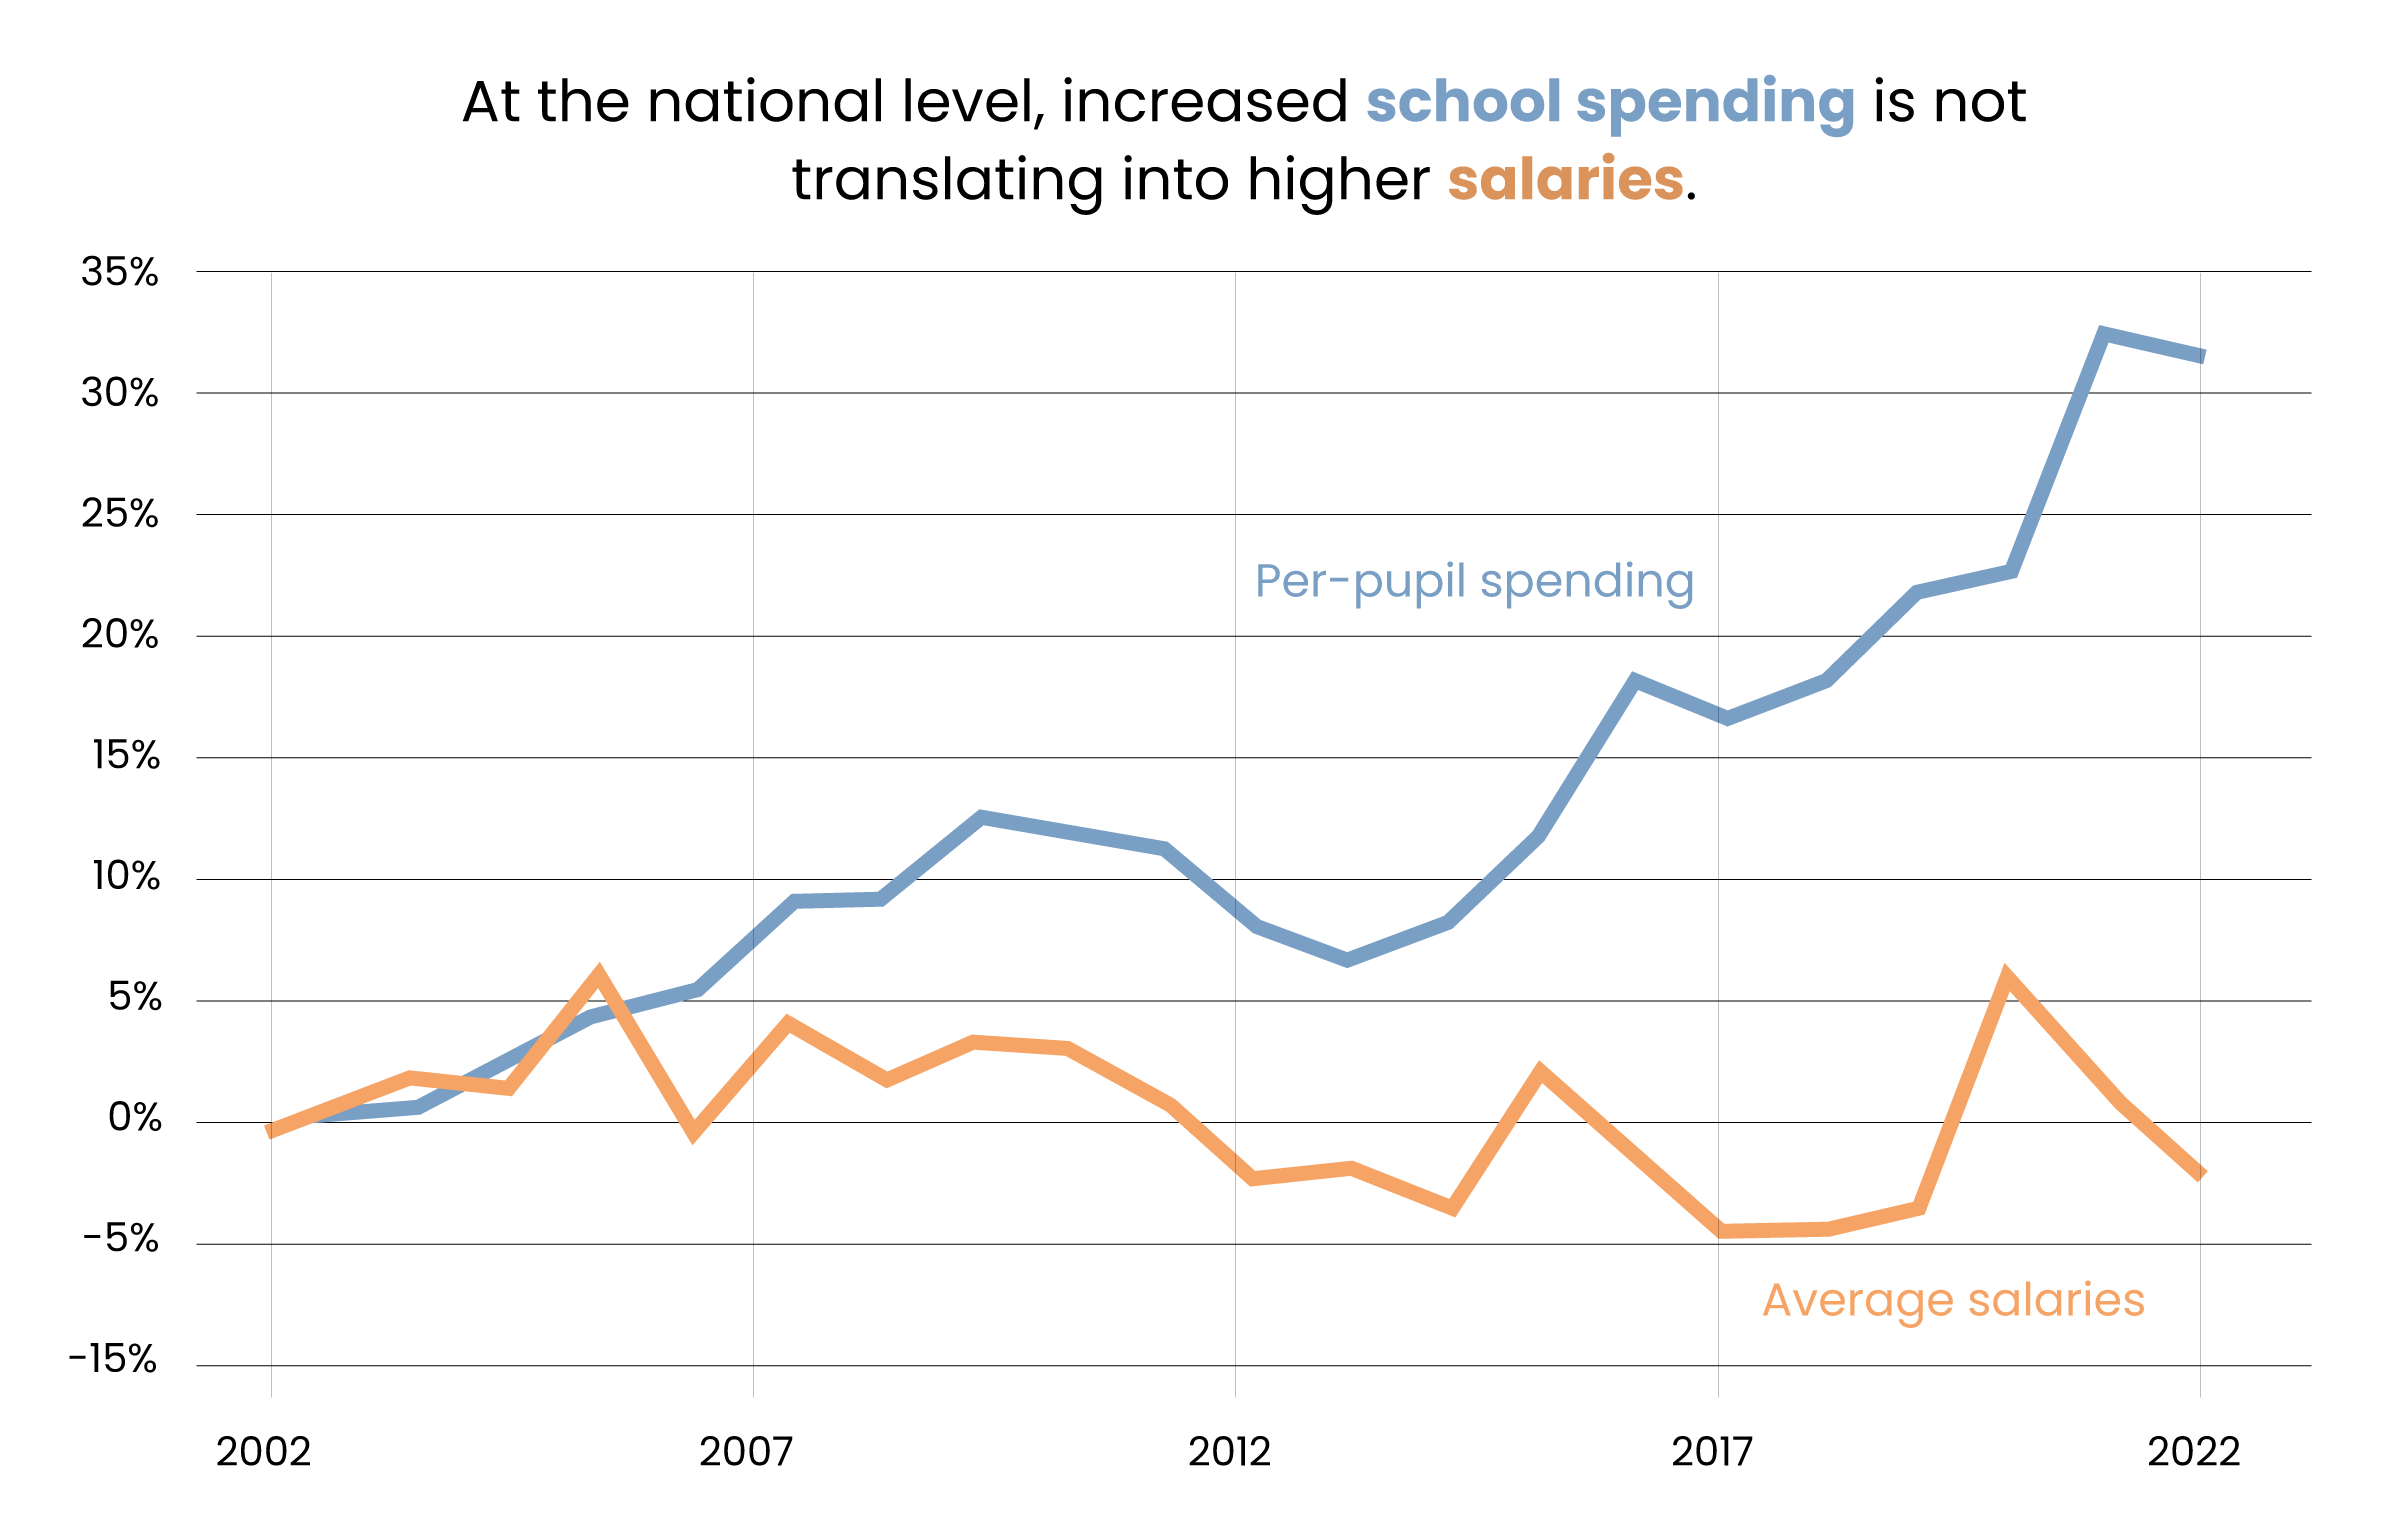
If district salaries had merely kept up with total education spending, they would have been 34% higher. That would have worked out to nearly a $22,000 raise for the average employee.
I’m not the first person to document this. Last year, the libertarian Reason Foundation published a report looking at state-level trends. It found that inflation-adjusted, per-pupil spending had risen across the country and in every state except North Carolina. And yet, there was not a single state where teacher salaries kept up with the pace of overall spending.
In my home state of Virginia, per-pupil school spending rose by 15% from 2002 to 2020 while teacher salaries fell by 4%. In California, spending rose 36% while teacher salaries increased by just 8%. In New York, school spending skyrocketed a whopping 70% while average teacher salaries rose by a more modest 16%. In Texas, school spending rose by 16% while teacher salaries crept up just 1%. Again, these figures are all adjusted for inflation.
What about individual school districts? I worked with Eamonn Fitzmaurice, The 74’s art and technology director, to look at local trends.
Unfortunately, there’s no national database of average teacher salaries by district, but we got pretty close. The NCES Common Core of Data collects the total salary expenditures per district and the total number of staff employed. By dividing these figures, we calculated an average salary across all employees in the district. These are not “teacher” salaries, but we think they’re a reasonable approximation. Particularly large changes in the growth of school spending versus employee salaries could be due to a variety of factors, including rapid increases in revenues or decreases in student enrollments, governance changes or data input errors.
We looked at revenue and salary expenditures from 2001-02 to 2021-22, the last year for which the data were available. We adjusted everything for inflation and took out districts with fewer than 500 students or missing data. That left 8,877 districts that educate about 90% of students nationwide. Use the interface below to see how per-student revenue and salary trends are changing in your community.
INTERACTIVE
School District Revenue vs Salary Change 2002-2022
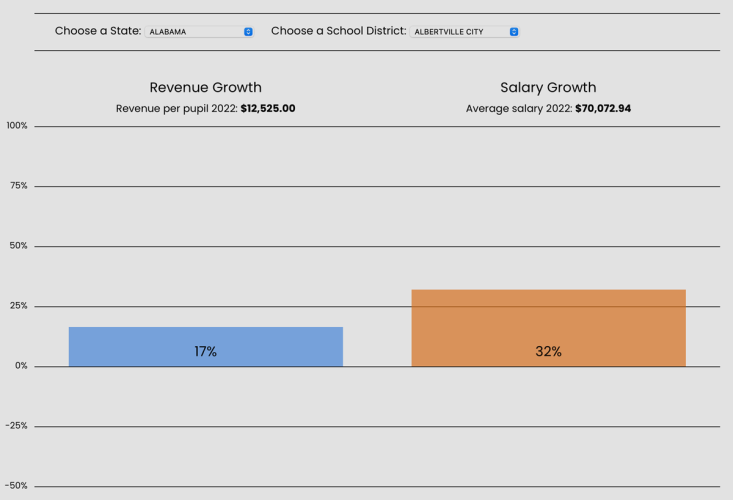
Revenue Growth
Salary Growth
Revenue per pupil 2022
Average salary 2022
For some districts, about 10% of our sample, salaries rose at a rate commensurate with district revenue increases. Washington state districts were disproportionately represented on this list, thanks in part to a large increase in state funding explicitly tied to teacher salaries.
But that means 90% of districts did not raise salaries in proportion to their revenue increases. This disconnect may help explain why some teachers feel their salaries aren’t keeping up with their expenses.
Take housing costs, for example. Imagine someone living on a teacher’s salary in Santa Monica, California, where housing costs are some of the nation’s highest. While policymakers have delivered on the budget side, and the total amount of money allocated to the Santa Monica-Malibu Unified School District has mirrored the rise in housing prices, that money isn’t translating into higher salaries. The district average actually fell by 19% over the last two decades, making it more and more difficult for employees to live in the city in which they work.
These trends are playing out across the country. In Billings, Montana, per-student revenue rose 51% while average salaries declined 32%. In Philadelphia, revenue per-student climbed by 155% while average salaries fell by 8%. In Buffalo, New York, revenue rose 114% while salaries fell 14%. In Jefferson County, Kentucky, revenue per-student climbed 62% while salaries rose a more modest 12%.
Where is the money going? The answers vary state by state and district by district, but the national trends provide at least some answers.
The biggest factor is the number and type of staff. Schools employ a lot more people than they used to, meaning they have to divide their budgets across more workers. While student enrollment rose 4% from 2002 to 2022, the number of full-time equivalent staff rose three times as fast, led by particularly large increases in instructional coordinators, classroom aides and district administrative staff.
But these figures actually mask another trend. According to Census Bureau data, schools employed about 200,000 fewer part-time workers in 2022 than they had in 2002. (Part of that decline was due to COVID.) Meanwhile, schools added 540,000 full-time workers. This shift carries real costs because two half-time employees don’t earn as much as one full-time employee, and part-time workers also don’t qualify for benefits like health insurance or retirement.
And the cost of those benefits has risen rapidly. Since 2004, the Bureau of Labor Statistics has broken out the components of the costs for a school district to hire and pay a teacher. In 2004, base salaries and wages represented 74% of a teacher’s total compensation package, the rest being a combination of health care benefits, retirement plans and Social Security contributions. Over time, total teacher compensation has grown faster than inflation, even though the salary component has not. Instead, benefits costs, especially on the retirement side, have increased rapidly, eating up a larger and larger share of district budgets.
These changes have been slow and gradual over many years, but they have all played a role in stagnant salaries. State, district and school leaders should dig into these trends if they want to boost take-home pay in their communities.
Clarification: This story has been updated to note that particularly large changes in growth of school spending versus employee salaries could be due to a number of factors. In addition, we noted that salary calculations do not include additional compensation such as retirement or health benefit contributions.
Get stories like these delivered straight to your inbox. Sign up for The 74 Newsletter
Chad Aldeman is a regular columnist for The 74. He writes about school finance, state assessments and accountability, and the teacher labor market. He is also the founder of Read Not Guess, a program to help parents teach their children to read
@ChadAldeman