First Civil Rights Data Since COVID Reveals Racial Divide in Advanced Classes
Other equity indicators — such as suspensions and corporal punishment — more difficult to compare because of 2020-21’s widespread school closures.

Get stories like this delivered straight to your inbox. Sign up for The 74 Newsletter
About 2.9 million high school students took at least one Advanced Placement course in the 2020-21 school year, according to the latest federal data measuring access to educational opportunity. But Black and Latino students were significantly underrepresented in those college-level math and science courses.
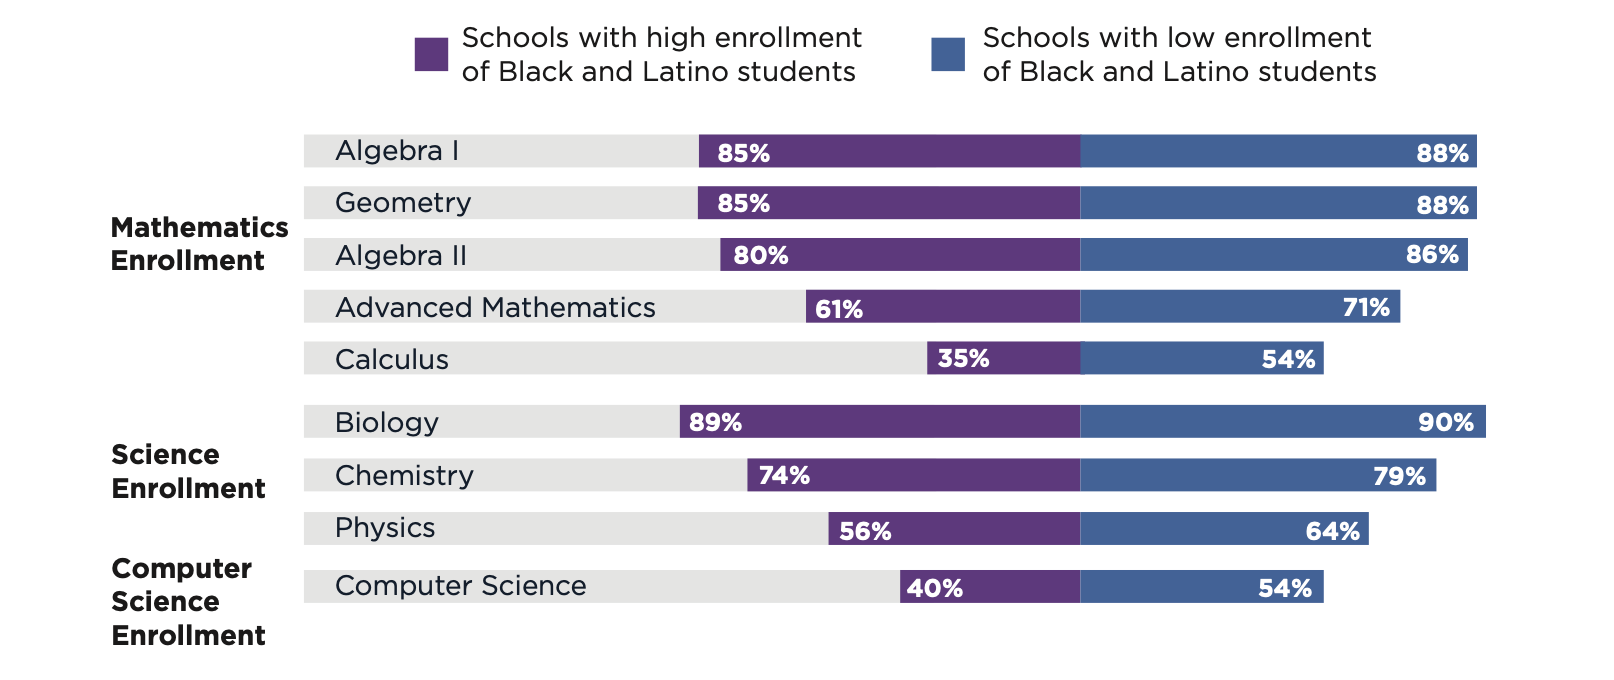
And schools in which at least 75% of students are Black and Latino offer fewer math, science and computer science courses than those with a low-minority population.
Those are among the racial disparities noted Wednesday in the Civil Rights Data Collection — the first released since 2017-18. Considering the data was collected when the vast majority of districts offered only virtual or hybrid learning, officials cautioned against making direct comparisons to previous years. But they also noted that among the many topics covered in the survey, including suspension rates, sexual harassment and school staffing data, course-taking trends might be less affected by the pandemic.
“Sadly, the inequities that have long persisted in our education system are on full display,” said Education Secretary Miguel Cardona, noting the department’s efforts to expand access to STEM learning through partnerships with NASA, nonprofits and the private sector. “We spent years fighting COVID; now we must fight complacency.”

COVID disrupted all aspects of the U.S. education system, and that includes federal efforts to measure how schools are protecting students’ civil rights. Officials canceled the 2019-20 survey and moved it to the following year, without knowing how COVID would continue to upend normal school operations. Many U.S. schools did not return to in-person learning full time until the 2021-22 school year. Prior to that, steep declines in areas such as out-of-school suspension or the use of corporal punishment are likely because many students were learning at home — not because schools stopped disciplining students.
That doesn’t mean the data isn’t useful for examining gaps based on race and disability. Assistant Secretary for Civil Rights Catherine Lhamon called the release “crucial civil rights data specific to students’ pandemic experience.” Others agreed that the data will help the nation better understand how the pandemic exacerbated inequities for vulnerable students.
“It won’t be an apples-to-apples comparison,” said David Hinojosa, director of the Educational Opportunities Project at the Lawyers’ Committee for Civil Rights Under Law. “At the same time, the whole intent behind the collection of this data is for schools, communities and civil rights enforcement agencies to identify and correct any civil rights disparities.”
‘Discipline looked very different’
As the primary source of information on school discipline, the survey shows that despite school closures, students missed more than 2 million days of school due to out-of-school suspensions during the 2020-21 school year.
Black boys were suspended at higher rates than boys of other races — a longstanding disparity. Black boys represented 8% of the total K-12 population but 18% of those that received one or more out-of-school suspensions. Black girls represented 7% of student enrollment, but accounted for 9% of students with one or more out-of-school suspensions. White girls made up 22% of the student population, but represented 13% of out-of-school suspensions.
This data was especially impacted by remote learning, noted Nancy Duchesneau, a senior P-12 research associate at EdTrust, an advocacy organization that focuses on educational equity.
“Exclusionary discipline looked very different during virtual learning,” she said. “Students were locked out of accounts, or removed from virtual learning environments, without official suspensions or expulsions. These instances of unofficial exclusionary discipline will not be reflected in the data.”
Despite 2020-21 being an unusual school year, districts still referred 61,900 students to law enforcement, which officials described as alarming, and 19,400 students received corporal punishment. Earlier this year, the department issued guidance urging schools to replace physical punishment with other methods.
The department also collected 2021-22 data and next month, districts can begin to submit responses for the current 2023-24 school year, putting the program back on its regular biennial schedule.
The 2020-21 findings confirm what some researchers captured during the pandemic — the decline in preschool enrollment, for example. In 2017-18, 1.4 million children attended a school district preschool program, but that dropped to 1.2 million, according to the latest data.
“People did not equitably have access to the internet,” Hinojosa said, “and they weren’t going to have their 4-year-old in front of the screen where they couldn’t learn.”
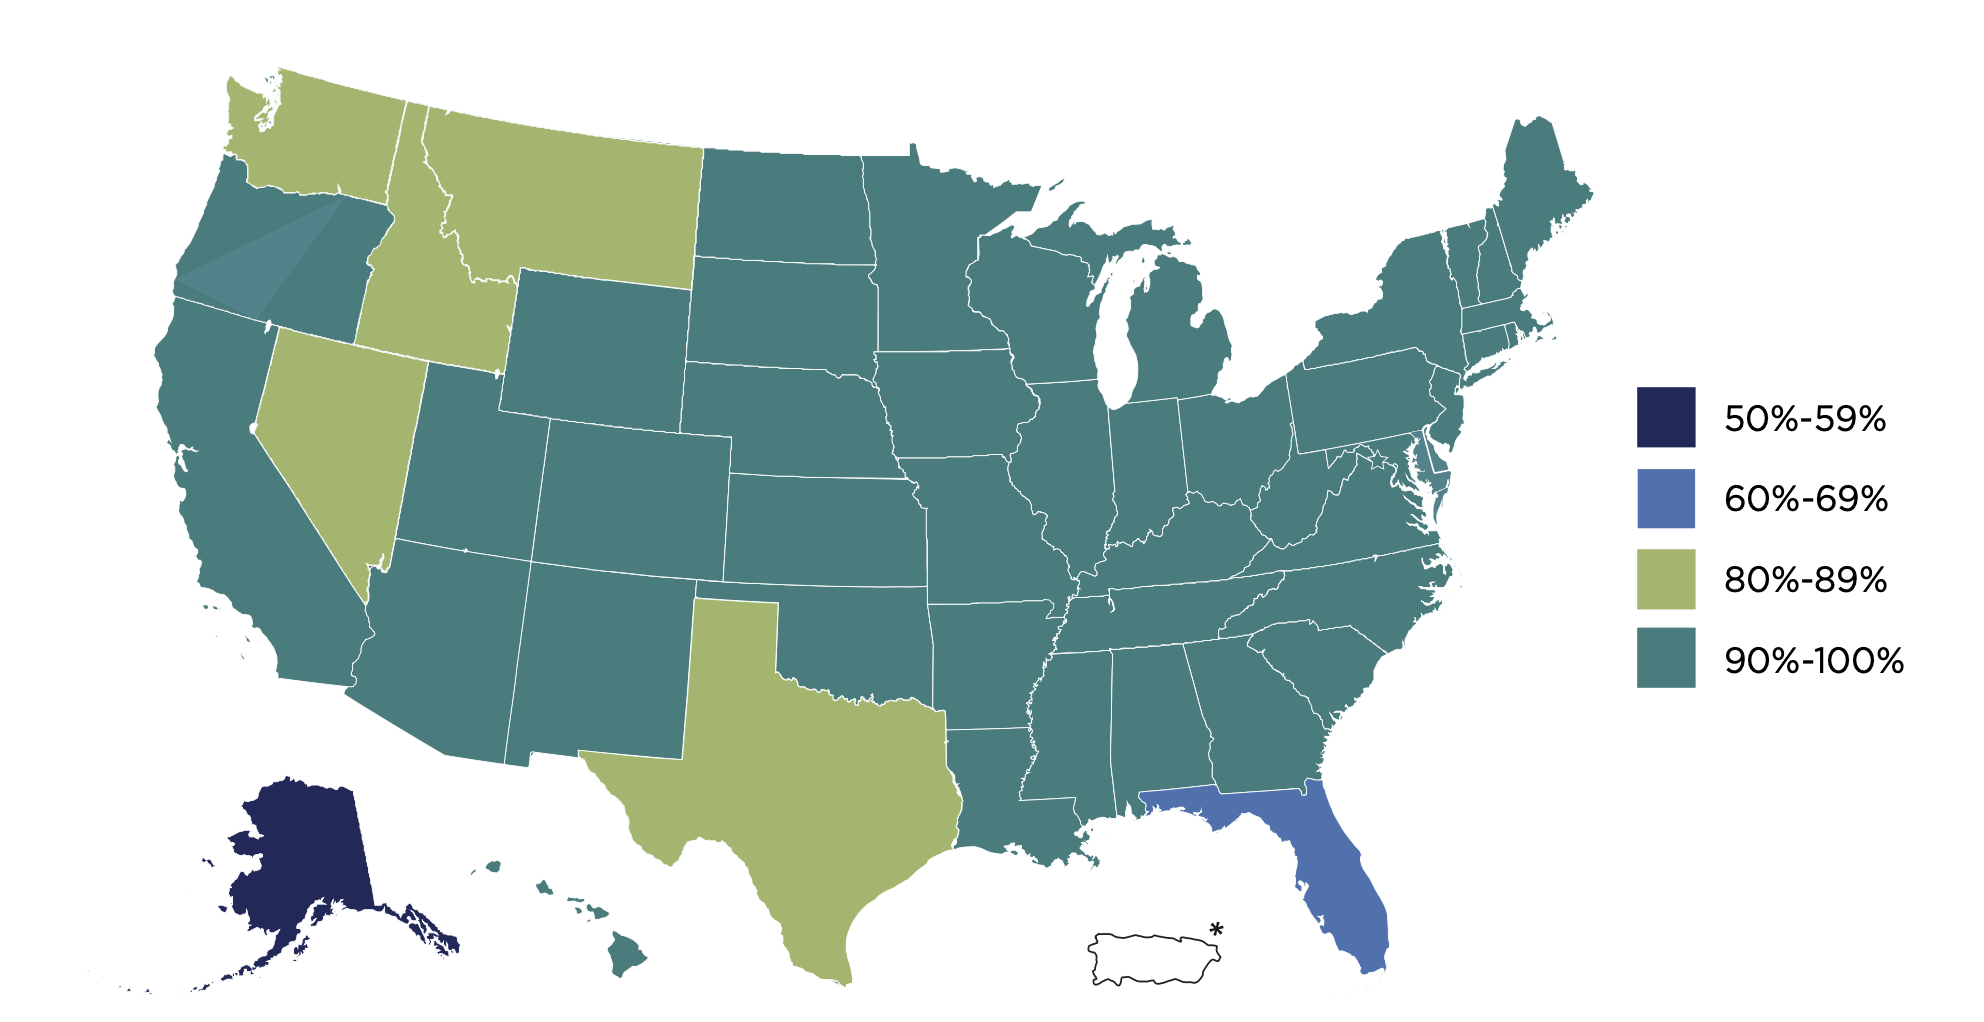
The survey, for the first time, included questions about students’ access to the internet and devices. Ninety-three percent of schools offer high-speed internet, and there’s little variation between high-minority and low-minority schools. But there were state-level differences.

Students in Alaska have the least access, where 59% of schools reported a high-speed connection, followed by Florida with 66%. Kentucky, Maryland, North Carolina, Virginia and West Virginia all reported 99% or more.
While most of the questions focused on in-school availability, the survey also showed that 87% of schools allowed students to take home devices.
Along with a series of national snapshots, the department also launched a new website with access to state and local data. That will allow for comparisons between states and districts that had different rates of in-person learning and home internet access, said Jennifer Bell-Ellwanger, president and CEO of the nonprofit Data Quality Campaign.
“We need this data even if it’s not as clear or clean as we might want,” she said. But she added, “It’s almost like a new baseline.”
Other top takeaways from the results are:
- Black students made up 15% of the total high school enrollment, but represented 6% of students enrolled in an AP math course. Latino students represented 27% of high school students, but 19% of those in AP math.
- Boys were more likely than girls to take Algebra I, physics and computer science. But girls had higher enrollment rates than boys in Algebra II, advanced math classes, biology and chemistry.
- White and Asian high schoolers were overrepresented in college dual enrollment courses, while Black and Hispanic students, English learners and students with disabilities were underrepresented.
- American Indian or Alaska Native students were 3.4 times more likely than white students to attend a school with a police officer or security guard, but without a school counselor, social worker, nurse or psychologist.
- There were 20,800 students disciplined for sex-based bullying or harassment in the 2020-21 schools year. White boys made up 24% of the total K-12 student enrollment but accounted for almost half of those disciplined for harassment or bullying on the basis of sex.
Get stories like these delivered straight to your inbox. Sign up for The 74 Newsletter

;)
