Even as California’s Student Suspensions Fell 46% Over the Past 6 Years, the ‘Discipline Gap’ for Black Children Remained as Wide as Ever

;)
Untangle Your Mind!
Sign up for our free newsletter and start your day with in-depth reporting on the latest topics in education.
Updated Aug. 8
Between 2011 and 2017, out-of-school suspensions in California fell 46 percent, as the state’s suspension rate dropped by more than a third.
That students are suspended less frequently is welcome news for civil rights advocates who’ve long been concerned about the fact that certain groups — black students, foster youth, and students with disabilities, in particular — are far more likely to face suspension than their peers. This disparity is often referred to as the discipline gap.
Tempering the optimism, however, is the fact that while suspension rates fell, the discipline gap didn’t close in any significant way, data show. In 2017, black students were suspended at a rate four times greater than white students — essentially the same ratio that had existed five years prior.
And although suspension rates have declined every year since 2011-12, pinpointing when and why they actually started dropping is surprisingly difficult. That’s because the California Department of Education cut off access to all suspension data prior to 2011, when it switched to a new data reporting system.
When The 74 Million requested the data from the California Department of Education last month, a department spokesperson wrote in an email that the data “has been archived and is not retrievable,” despite the fact that it had been previously published online.
That makes it challenging to attribute the fall of suspension rates to specific policies or efforts.
Suspensions fell 46 percent, from 709,702 in 2011-12 to 381,845 in 2016-17. The suspension rate was 5.7 percent in the 2011-12 school year. By 2016-17, it had dropped by more than a third, to 3.6 percent.
The state’s suspension rates generally mirror national trends, experts say, which have been falling alongside California’s. Much credit for the decline has been given to former president Barack Obama, who in 2014 issued guidance that encouraged states to reduce suspensions and address the disparities between student groups.
That guidance came under scrutiny in the wake of this year’s school shooting at Marjory Stoneman Douglas High School in Parkland, Florida. Conservative-leaning groups pushed U.S. Secretary of Education Betsy DeVos to repeal the guidance, arguing that it led to an overly permissive approach to discipline, inviting violence and disruption.
But education policy expert Tom Loveless, who produced a 2017 report on California’s suspension data for the Brookings Institution, believes the Obama-era guidance had little to do with falling suspension rates in the Golden State — because “the trends were in place well before then,” he said.
More relevant to the declines, Loveless said, was a growing awareness of disparities, thanks in large part to reports from UCLA’s Civil Rights Project — which were well-covered by media outlets — as well as efforts at the state and local levels to curb the use of suspensions for petty infractions, such as disrupting class, using cell phones, or refusing to do school work.
“Frankly, I think there was just something in the water, and people started to pay more attention to the suspension rates and the disparities between races,” Loveless said.
The 74 took a closer look at the factors that came together in California over the past decade and fleshed out their impact on suspension rates. We found that declining suspension rates can’t be attributed to a single factor but rather to a number of things, including improved data collection, legislative action, and, as experts say, possibly some data manipulation.
California curbs use of ‘willful defiance’
The rise of out-of-school suspensions is sometimes attributed to a defensive reaction to the shooting at Columbine High School in 1999.
But Dan Losen, director of UCLA’s Center for Civil Rights Remedies, said rising suspension rates were more likely an outgrowth of the zero-tolerance policies ushered in by the War on Drugs. As the influx of cocaine led to increased street crime through the 1980s, and as politicians popularized the concept of the dangerous black male “super predator” in the 1990s, the tough-on-crime approach trickled down to school discipline policies.
“There’s not a shred of evidence that supports the idea that suspensions actually help students, but the spare-the-rod, spoil-the-child idea that you have to kick out the bad kids has been deeply entrenched ever since,” Losen said.
He said suspension rates continued to rise nationally throughout the 2000s and peaked around 2011, depending on the state.
By then, Losen’s reports for the Civil Rights Project had helped put the discipline gap on the radar of California legislators and school district administrators, particularly when it came to “willful defiance,” a kind of catchall category that allows principals to suspend kids for reasons ranging from talking back to teachers to using cell phones in class.
In 2012, a bill that called for a ban on willful-defiance suspensions for K-12 schools was approved by the legislature but was opposed by organizations representing administrators and teachers. Gov. Jerry Brown ultimately vetoed the proposal.
In 2013, Los Angeles Unified passed its own policy to limit suspending students for willful defiance, and other school districts followed suit. Then, in 2014, the legislature passed a law prohibiting its use for students in grade 3 and below. California lawmakers renewed that ban in June.
Curbed use of disciplinary action for willful defiance appears to have had a big impact on the overall numbers in California.
In 2013, the year before the ban was established for grades 3 and below, suspensions for willful defiance accounted for 42 percent of all student suspensions. By 2017, they made up only 20 percent.
Still, black students remain overrepresented in the population of students suspended for willful defiance. In 2013, they accounted for 6.5 percent of enrollment yet represented 18.9 percent of suspensions for willful defiance. Five years later, they made up 5.7 percent of the student population and 16.5 percent of defiance suspensions.
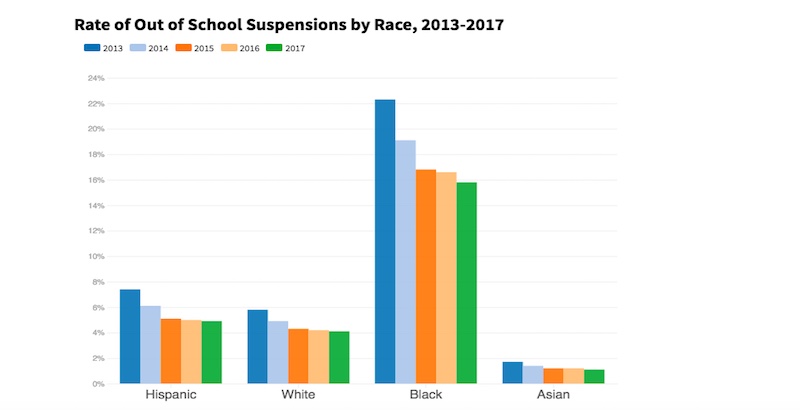
The disparities hold true in other suspension categories. White and Latino students tend to be suspended at roughly the same rates, and Asians are suspended less frequently than any other group.
“So it’s really black students compared to every other race,” Loveless said. “Reducing suspensions across the board did not change the fact that black students were suspended at much higher rates than virtually everyone else.”
Data show that even while suspension rates fell across the board, the rate for black students dropped the least. In fact, in 2017, black students were still being suspended at four times the rate as whites — and that gap had widened slightly from 2013.
Suspension rates for black students dropped from 22.3 percent to 15.8 percent between 2013 and 2017. Latino suspensions fell at the steepest rate: 34 percent.
Data: California Department of Education. Graphic: The 74
Data: California Department of Education. Graphic: The 74
Measure the data and it will improve
Recent trends notwithstanding, out-of-school suspensions tend to rise and fall cyclically, similar to crime rates, Loveless said.
“Suspension rates go up, then people think schools are being overly punitive. So schools make changes, and suspension rates fall. Then people say schools are being too permissive,” he said.
What is new, he said, is that states are doing a better job of collecting suspension data — which until about 15 years ago tended to be spotty — and making concerted efforts to bring the numbers down. This is especially true in California.
The Every Student Succeeds Act, the federal law signed in 2015, called on states to choose their own way of evaluating schools that didn’t revolve around academics.
California chose to include suspension rates in its ESSA plan. But that merely reinforced a trend that was already in place. Growing pressure from advocacy groups and a desire to avoid scrutiny from state and district officials probably led California schools to reduce their use of suspensions, Loveless said.
“When the legislature starts to get involved with what schools can and can’t do, schools tend to react defensively and make concerted efforts to improve the data,” he said.
Some researchers, teachers, and administrators have expressed concern that although well-intentioned, the incentives have caused districts to focus exclusively on bringing down the numbers without regard for disruptive behavior.
Max Eden, a senior fellow with Manhattan Institute, believes the Obama-era guidance carried an implicit threat that if school districts didn’t bring down suspension rates, they would face cuts in federal funding or investigations by the Office for Civil Rights. Eden is among those pushing DeVos to repeal the guidance.
“Ultimately, it amounted to a shakedown,”Eden said. “When you apply a top-down pressure toward a numerical goal, it guarantees this type of reaction from school districts.”
It’s hard to tell whether falling suspension rates translate into improved student behavior.
Teachers in school districts around the country, such as Oklahoma City and Buffalo, have said that softened, therapeutic-minded approaches to discipline, sometimes referred to as restorative justice, have led to chaotic classrooms where disruptive behavior goes unchecked.
Elsewhere, reporters have found that schools bury suspension numbers by taking unofficial actions that keep them off the books.
At one troubled school in San Diego Unified, a former vice principal said that, facing top-down pressure to keep suspension rates low, administrators would simply send students home for the day instead of suspending them. A district spokesperson confirmed the practice and said that while not in line with district policy, sending students home can be an effective way to “defuse a situation.”
The Washington Post reported on a similar trend in D.C. public schools last July. The Post found that at least seven of the district’s 18 high schools had kicked students out of school for the day without labeling those actions as suspensions.
Loveless called the situation in D.C. schools a clear example of Campbell’s Law: that is, once a metric is identified as a measure of success, it invites schools to game the system to improve the statistics.
And despite being a leading proponent of discipline reform, Losen said it becomes difficult to study suspension rates if schools are fudging data.
Losen and Eden are on opposite sides of the school-discipline spectrum, but on this point they agree: “It’s hard to do research when schools are cooking the books, and that’s true for test scores, graduation rates, and suspensions. Doing so is a disservice to kids,” Losen said.
Still, Losen said it’s highly unlikely that data manipulation is widespread enough to explain the trends in suspension rates writ large.
He chalked falling suspension rates up to “common sense” among educators that students can’t learn if they’re not in school.
“The things that work make everyone feel safer. Restorative justice, in the schools where it’s well implemented, fosters an effective school environment where all the kids feel safe,” he said.
Update: This article was updated to include more precise data on the persistent discipline gaps between different racial subgroups.
Get stories like these delivered straight to your inbox. Sign up for The 74 Newsletter
Mario Koran is The 74’s California correspondent and a staff reporter with our sister site LA School Report.
@MarioKoran mario@the74million.org