Don’t Shut Advanced Programs that Keep Students Out — Use Data to Invite More In
Glynn: Enrollment and test data can tell school leaders at all levels who participates, how they fare and which programs must cast a wider net.


;)
Untangle Your Mind!
Sign up for our free newsletter and start your day with in-depth reporting on the latest topics in education.
Get stories like this delivered straight to your inbox. Sign up for The 74 Newsletter
Advanced education in the United States is undergoing a transformation. As advocated by the National Working Group on Advanced Education in Building a Wider, More Diverse Pipeline of Advanced Learners, educators are shifting away from narrowly defining giftedness as an endowed trait of a handful of students and toward an expansive focus on equity and excellence. With belief that talent can be developed and confidence that children will rise to expectations, schools are encouraged to provide a continuum of advanced learning opportunities for a broader set of students beginning in elementary school and continuing through middle and high school.
This expansion is critical because many students with high potential do not have access to or participate in advanced learning. For example, fewer students in Title I schools than non-Title I schools are identified for advanced education, and Black and Hispanic students are underrepresented among Advanced Placement exam takers. Inequities in student participation are so stark that some parents are calling for the dismantling of advanced programs entirely. But that’s not what’s needed. We need more of these programs, coupled with systematic examination of participation and outcomes to identify inequities, eliminate barriers to inclusion and build programs that involve students from all backgrounds.
Collecting, reviewing and acting upon student participation and performance data is essential. Administrators can utilize state, district, school and classroom data to understand who participates and how they fare, and to identify programs where students are systematically underrepresented. There is little need to collect new statistics; existing enrollment and standardized test data will provide sufficient information. For example:
- At the elementary level, educators should track and examine enrollment in gifted and advanced classes and the percentage of students reaching the highest level on state assessments in math, reading and science.
- In middle school, educators should track and examine enrollment and grades in honors courses, data on how many seventh- or eighth-graders complete algebra and the percentage of students reaching the highest level on state assessments in math, reading and science.
- In high school, educators should track and examine enrollment in AP or International Baccalaureate courses and performance on subsequent examinations; honors coursework; participation in dual degree programs or college courses; and the percentage of students reaching the highest level on state assessments in math, reading and science.
In addition, student growth should be measured in each grade. Very large percentages of students begin school each fall at grade level, because students in the United States are grouped based on their age, not knowledge levels. Comparing performance at the beginning and end of each year can help ensure that all students learn, even those who are ahead of the curve.
Most importantly, data should be disaggregated by gender, race/ethnicity, family income and English learner status, to identify discrepancies that can be addressed with targeted programming or outreach. Annually reviewing participation and outcome data can help educators identify students who might benefit from advanced learning, need more support to succeed or are underrepresented.
When I directed the Jack Kent Cooke Foundation’s research initiative, I visited Virginia’s Department of Education to discuss the Governor’s School Program for advanced learners. Staffers described numerous barriers to participation faced by lower-income students, including parents’ disparate access to information, lack of teacher referrals and language gaps. Yet ,when I asked how many lower-income students were enrolled, they did not know. Why? Because student income is captured by the financial aid department, not the system’s enrollment database.
We don’t know what we don’t measure. Many useful data exist, but pulling them together coherently requires intention. Data can be shared internally with administrators or externally with all stakeholders. Analysis can range from reporting head counts in a table to building interactive comparative displays of statistics. While directing gifted education in Paradise Valley district in Arizona from 2006 to 2022, for example, Dr. Dina Brulles annually reported state assessment math and reading results broken down by district and school, to make clear the percentage of students scoring as proficient versus advanced. Every year, she created pie charts by grade, gender and ethnicity, so administrators could see where discrepancies were and create flexible learning groups so all students were challenged.
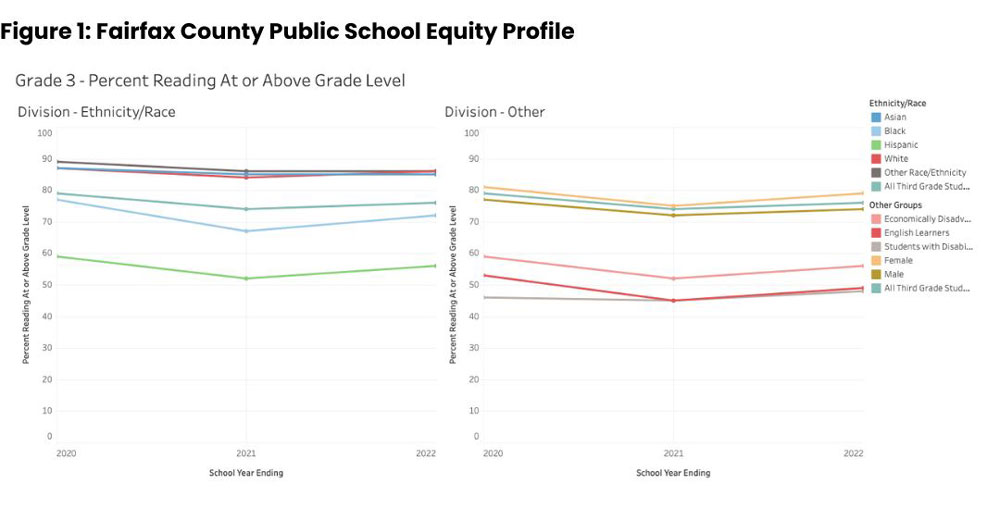
New software tools make this even easier. For example, Virginia’s Fairfax County Public Schools uses Tableau, a data analytics platform, to generate an Equity Profile. This website publishes annual performance measures at the school and district level using interactive displays that viewers can customize to show data for specific schools or student populations. For example, the figure below shows the percentages of various student groups scoring at or above grade level for third grade reading. It’s great that the district shares these data publicly; even better would be if they also reported learning at the advanced level.
Last month, the Supreme Court ruled that colleges cannot use race in admissions decisions. Yet racial differences still drive the percentages of students who have access to and successfully complete advanced courses that are often heavily weighted in admissions to selective colleges and universities.
Using data to understand which K-12 students participate in advanced learning, how they are doing, who might benefit from inclusion and who is being excluded can identify places where educators need to redesign coursework or bolster supports to enable more students from all backgrounds to successfully complete these courses and become college-ready. This will help ensure that colleges and universities have access to a pool of academically talented students whose demographic backgrounds match the nation’s great diversity, preserving education’s role as a pathway to upward mobility. To do anything less sells short the American Dream of opportunity and advancement for all.
Get stories like these delivered straight to your inbox. Sign up for The 74 Newsletter
Dr. Jennifer Glynn is an independent consultant who recently served as a member of the National Working Group on Advanced Education; a former director of research and evaluation at the Jack Kent Cooke Foundation and senior associate at Abt Associates; and co-author of "Small Town, Big Talent.