Analysis: What Are Districts Using Their Federal Relief Money for? How Fast Are They Spending It? How Much Is Left? New Interactive Database Has Answers

;)
Untangle Your Mind!
Sign up for our free newsletter and start your day with in-depth reporting on the latest topics in education.
Get stories like this delivered straight to your inbox. Sign up for The 74 Newsletter
A year ago, school districts wrote plans for how they were going to use their share of the $122 billion in American Rescue Plan money.
Fast forward to today, and information is starting to emerge about how schools are actually spending their windfalls. Martha’s Vineyard Public Schools in Massachusetts has already spent all of its nearly $400,000 allotment. Meanwhile, in Detroit, the school district hasn’t used any of the hundreds of millions sent its way.
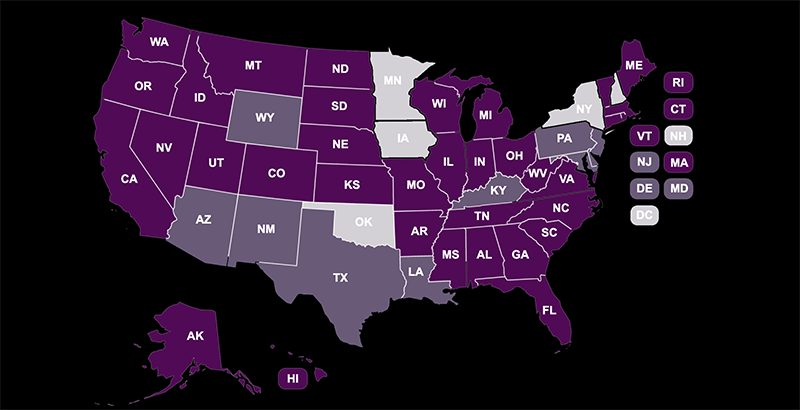
Because Congress directed the money to flow through states, districts file for reimbursement as the funds go out the door. Our team at Edunomics Lab is compiling this data — reflecting actual spending, district by district — and has posted the early results in this ESSER Expenditure Dashboard.
Wondering how much remains to be spent in your district? The dashboard allows users to type in a district to see how fast (or how slowly) the money is being used. Or they can download an entire state’s file and run some analytics to see what the trends look like.
In some states, the dashboard includes additional detail on what those dollars paid for. In Olympia, Washington, the biggest investment so far is for mental health. In Gulfport, Mississippi, it’s facilities. In Little Rock, Arkansas, the largest investment is in student support. In Lewiston, Maine, much of the money is going to a sizable investment in staff training.
Overall, it is clear that districts are making very different choices with their money, and the pace of spending appears to be slow. In California, for instance, 41% of districts hadn’t been reimbursed for even a dime of relief plan spending through the middle of the school year. That includes big districts like Los Angeles Unified, Fresno and Long Beach, California.
For states where the dataset includes details on what was purchased, salaries and benefits are the largest category of spending. In places like Alaska and Oregon, over half of the money is going to labor costs. In Mississippi, 11 districts, including larger ones like Choctaw and Desoto counties, have devoted all of their rescue plan spending so far in those areas.
Other districts have put their early priorities elsewhere. In South Dakota, the Centerville district had already spent two-thirds of its funds on equipment. In Rhode Island, the Coventry district has been reimbursed $571,104 for property and equipment. And in California, San Francisco has categorized nearly all of its rescue plan spending so far under the broad umbrella category of “other maintenance.”
In some states, it is possible to zero in on the portion of funds intended to address the academic impact of lost instructional time. Congress required districts to set aside at least 20% of the money for that purpose, but most districts have a long way to go to reach the federal minimum.
In Wasington state, for example, while nine districts have already met the federally required minimum, about half of districts have not yet spent any rescue plan money earmarked toward learning loss. That includes larger districts like Seattle, Tacoma and Olympia. In other states breaking out this data so far, 80% to 90% of their student learning loss money remains unspent.
In California, 99% of that funding remains. Of the amount that has been spent, only 27% has gone toward summer or afterschool programs, or an extended school day or year. To date, the biggest category — capturing 73% of the total — is “other interventions.”
In order to unlock all their money, districts had to submit a draft plan indicating their spending priorities. Too often, however, those early drafts were little more than placeholders, as conditions and finances were changing quickly. Some districts pivoted toward hiring or retention bonuses when a tight labor market left some positions unfilled. The rapid rise in inflation meant the actual costs of construction or maintenance were far higher than originally planned. In other districts, declining enrollments prompted leaders to direct funds to offset budget gaps. It’s no surprise, then, that in many districts, actual spending is not matching the original plans.
The bottom line from the database is that in many places, there is still a lot of federal relief money left, and with that comes a responsibility to ensure it helps kids. For parent advocates, there is still time to ask to see how the money is being spent and how it’s affecting their children. Now is a great time for school communities to come together and examine the progress their kids have made (if they have) and whether it makes sense to alter spending plans going forward.
We hope district leaders, advocates, reporters and others will dig through the numbers to see how spending looks in their communities. Is the district on track to use its money by the September 2024 deadline, or does it need to speed up or slow down? How does spending so far compare to the original plan? Were most of the funds are spent on labor? Does the district have a plan for what to do when the federal money runs out? And most importantly, are the funds being targeted to the students and schools who need them the most?
Disclosure: Walton Family Foundation and the Bill & Melinda Gates Foundation provide financial support to Edunomics Lab and The 74.
Chad Aldeman is policy director of the Edunomics Lab at Georgetown University. Katherine Silberstein is a research fellow at the Edunomics Lab at Georgetown University. Aashish Dhammani is a research fellow at the Edunomics Lab at Georgetown University.
Get stories like these delivered straight to your inbox. Sign up for The 74 Newsletter
Chad Aldeman is a regular columnist for The 74. He writes about school finance, state assessments and accountability, and the teacher labor market. He is also the founder of Read Not Guess, a program to help parents teach their children to read
@ChadAldeman
Katherine Silberstein is the strategic projects lead at the Edunomics Lab at Georgetown University.
[email protected]
Aashish Dhammani is a research fellow at the Edunomics Lab at Georgetown University
[email protected]