Analysis: California Gives Districts Extra Money for Highest-Needs Students. But It Doesn’t Always Get to the Highest-Needs Schools

;)
Untangle Your Mind!
Sign up for our free newsletter and start your day with in-depth reporting on the latest topics in education.
Under California’s Local Control Funding Formula, the San Diego Unified School District’s highest-needs schools generated $1,468 more per student in 2016-17 than the average amount generated across all district schools. Yet, according to our new study, once that money passed through the district, those same neediest schools wound up receiving $127 less per student than the district’s average school. In fact, 12 of the 14 California districts we studied passed along a smaller share of formula-generated dollars to the schools with the highest-needs students.
Under the formula, allotments are weighted to deliver more dollars for students with additional needs, such as those who are foster youth, English learners and/or living in poverty. Those weights mean districts with more of these high-needs students receive more dollars per student. But once the funds arrive at the district, the state does not require that the additional dollars get spent on the schools that actually serve the students who generated those funds in the first place. Districts can hold a portion back for central services, or even direct that money to schools without any of the high-needs students who generated it.
Given this loophole, our team at Edunomics Lab wondered if these extra weighted dollars were in fact making it to high-needs schools. We analyzed 14 districts of varying sizes, including some of the state’s largest systems. For every school in those 14 districts, we paired California Department of Education Report Card data with the School Accountability Reports’ unrestricted spending data from the 2016-17 school year. What we found surprised us.
As we followed the funding formula money, we found that five of the 14 districts actually spent less per student on their highest-needs schools on average than on the rest of their schools. That means that while the state gave the district more funding for the highest-needs students, districts in San Diego, Los Angeles, Long Beach, Sacramento and Fontana weren’t using those dollars to boost spending on schools serving the highest-needs students by so much as a dime.
Five districts delivered fewer Local Control Funding Formula dollars to their highest-needs schools even though those schools generated more of that funding from the state.
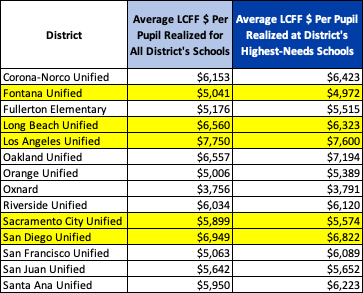
While the remaining nine of the 14 districts did spend more per pupil on their highest-needs schools, we wondered if those schools got a bigger share of the funding formula dollars that their student population generated for the district compared to the rest of the district’s schools. To find out, we compared the funding formula revenue generated by students in each school with those that the district actually spent on that school.
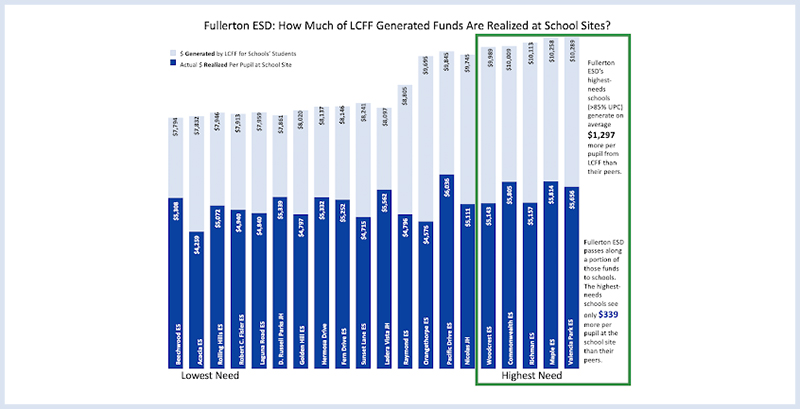
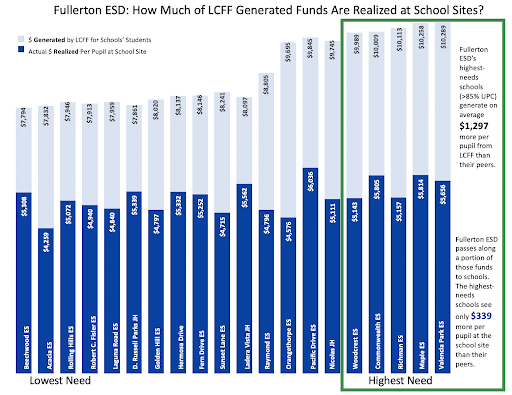
Take Fullerton Elementary School District. On average, the district spent $339more per pupil on its five highest-needs schools. But those same five highest-needs schools generated $1,297 more per pupil on average from the funding formula than the other district schools.
Fullerton ESD receives more formula funding for its highest-needs schools, but not all those dollars make it to those schools.
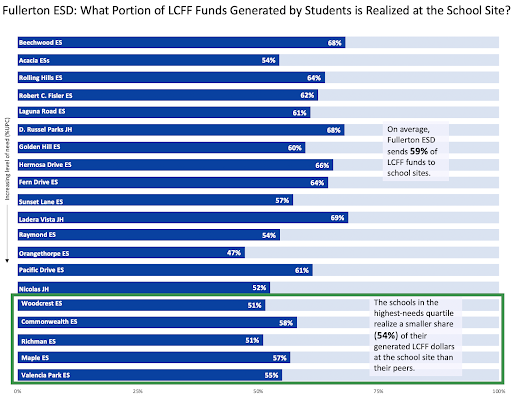
When we look at Fullerton ESD, we see the district sent 59 percent of its formula funds to schools, on average. But the highest-needs schools on average received just 54 percent of their students’ generated funding formula dollars.
Fullerton ESD passes a smaller share of formula dollars to its highest-needs schools.
When we look across all 14 districts in our study, we see that while nine spent more per high-needs student, just two spent proportionately more. In other words, in only two districts did high-needs schools get a bigger share of the funding formula dollars that their student population generated for the district than the share that a typical district school got.
In most districts, the amount of funds received by the schools is much less than the amount generated on behalf of the students because central offices hold back a portion of the funds for operational expenses, shared services (like professional development) and anything else not accounted for at the school. Thus, we did not expect the dollars received by the schools to equal the amount generated by the school’s students. Also note that our analysis examines only unrestricted dollars and thus excludes special education, transportation and other restricted expenses.
The pattern this study reveals in these districts is clear. Although the California state funding formula generates more money for highest-needs students, each district ultimately decides whether and to what extent to pass along those extra dollars to the schools whose students generated those dollars.
12 districts delivered proportionately fewer funding formula dollars to their highest-needs schools.
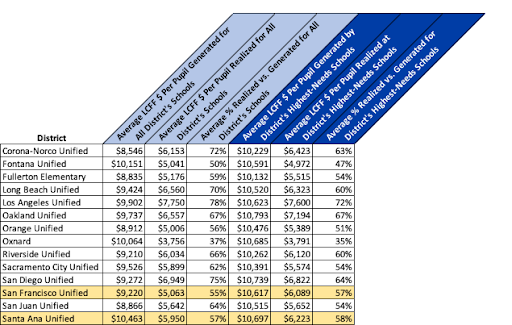
Drawing on the data in the first chart, this one includes average dollars per-pupil generated for all schools in the district and for the district’s highest-needs schools. We then created ratios comparing dollars realized against dollars generated for all schools in the district and for the highest-needs schools. We found that 12 of the 14 districts withheld a larger share of the formula-generated dollars from its highest-needs schools than from its typical schools. So, taking into account the funds that students in the highest-needs schools generated under the funding formula, most districts in effect diverted dollars away from those schools.
Back in 2013, when state lawmakers crafted the formula to drive more resources for students with higher needs, the idea was to ensure that the money was kept “flexible.” Districts would figure out how best to use the it. But did that flexibility come at the expense of equity?
In our view, flexibility and equity needn’t be at odds. Districts can still have flexibility over what the money buys and what services are delivered — but still be accountable for ensuring that the dollars flow in a way that benefits the schools serving students for whom the funds were intended.
That’s where the state’s requirement that districts complete a Local Control and Accountability Plan could have played a role. Instead of requiring an analysis of how the district’s money would be doled out by school, the plan’s template asked about the district’s larger strategies to meet students’ needs. Given the state’s intent, the plan missed perhaps the most useful accountability information of all: How equitably was the district deploying its resources across schools?
It’s a glaring omission, especially given that policymakers have been measuring outcomes by school for years. Leaders know which schools have the highest and lowest outcomes, but not which have the most and fewest dollars.
Analyses like the one we’ve done here, which indicate both the amount and percentage of dollars that schools received compared to what they generated, could help districts deploy funds in more equitable ways.
We hope California’s state leaders find the issue worthy of attention. Meantime, the federal government already has. The Every Student Succeeds Act required states and districts to publish Fiscal Year 2019 school-by school spending data by June 2020. (California is one of five states that, to date, has not met this deadline.) Other federal guidance under the landmark Title 1 poverty program asks districts to articulate their method for allocating resources to schools. And yet another ESSA provision calls on state education agencies to conduct periodic reviews of districts’ resource allocations to support school improvement.
Given these requirements, now is an opportune time for California’s leaders to press districts for more intentional allocation decisions that more equitably divide funds across schools. Otherwise, the equity aspirations behind California’s Local Control Funding Formula may never be fully realized.
Katie Silberstein is a research fellow at Edunomics Lab at Georgetown University and a former elementary school teacher. Marguerite Roza, Ph.D., is director of the Edunomics Lab and a research professor at Georgetown University.

Get stories like these delivered straight to your inbox. Sign up for The 74 Newsletter
Katie Silberstein is a research fellow at Edunomics Lab at Georgetown University and a former elementary school teacher.
[email protected]Marguerite Roza, Ph.D., is director of the Edunomics Lab and a research professor at Georgetown University.
[email protected]