68 Years After Brown, Schools Still ‘Highly’ Segregated: 4 Takeaways from Study
Century Foundation report shows students in the New York and Milwaukee metro areas are among the most racially isolated

;)
Untangle Your Mind!
Sign up for our free newsletter and start your day with in-depth reporting on the latest topics in education.
Get stories like this delivered straight to your inbox. Sign up for The 74 Newsletter
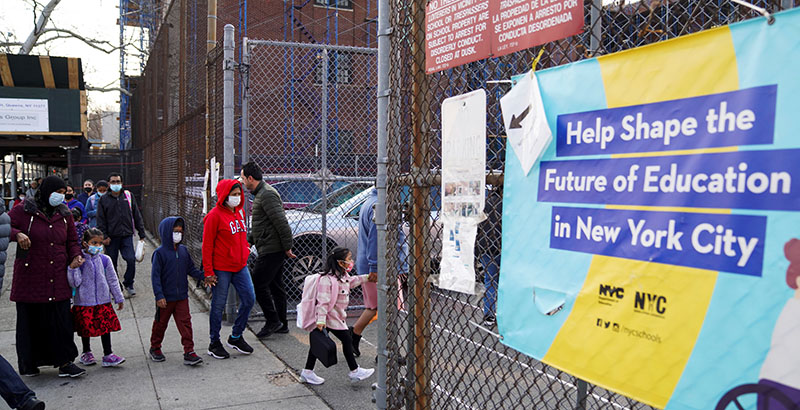
In the 2018-19 school year, one in six students attended a school where over 90% of their peers were of the same race, with school districts in New York City and Milwaukee among the most segregated, according to a new study released Tuesday.
The publication of the report from The Century Foundation, a progressive think tank, was timed to mark the 68th anniversary of the U.S. Supreme Court’s decision in Brown v. Board of Education and demonstrates the degree to which the nation’s schools remain segregated by race long after it was legally outlawed.
‘Pernicious’ segregation between school districts, not within them, is the primary reason for racial isolation in 280 out of the 403 metro areas, the report said. That is particularly true in the Northeast and Midwest, where counties often have multiple small school districts. Within-district segregation is greater in the South, which tends to have larger, countywide districts.
“The way that district lines are drawn has a huge impact on segregation and the resources that students in segregated districts have,” said lead author Halley Potter, a senior fellow at the progressive think tank.
Enrollment losses in urban public schools, exacerbated by the pandemic when many students left for private and charter schools, have likely contributed to further racial isolation in some communities, Potter said. But she chalked up the chief causes of segregation to migration, immigration and population growth. School attendance policies that keep students from enrolling in neighboring districts and white residents’ push to secede from majority minority districts are also contributing factors.
The Biden administration has proposed policies to address the issues, including a $100 million grant program to support racial and socioeconomic diversity. Potter said states also have “carrots and sticks” to achieve more integrated schools.
For example, states can allow students to transfer across district lines. They also can design magnet schools to draw students from multiple districts. And they can require districts to take diversity into account when making boundary changes — a practice that only Arkansas and California have implemented.
“It’s a lot of work and coordination to get individual districts to come up with this on their own,” she said, adding that if more states prevented secessions and actively encouraged district mergers that promote integration, “that could be a powerful tool for tackling interdistrict segregation.”
The report complements recent research from Bellwether Education Partners that focused on “border barriers” — district boundaries that keep low-income families from enrolling their children in higher-quality schools.
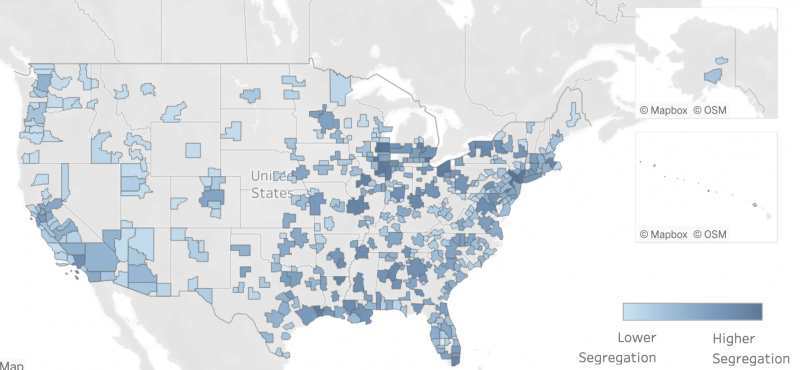
The Foundation’s report features a first-of-its-kind interactive School Segregation Data Dashboard — developed by Ann Owens of the University of Southern California and Sean Reardon from Stanford University — that allows users to isolate metro areas and different types of segregation. The team developed a measure that ranges from 0, which means no segregation, to 1, which indicates students attend schools with no students from other races.
Here are four takeaways from the data:
1 Milwaukee leads the pack
Overall, Black-white segregation is especially pronounced in 39 — or about 10% — of the nation’s 403 metro regions, including Milwaukee (.73), Newark (.71), Chicago (.70), Detroit (.70) and New York (.69).
Hispanic-white segregation is greatest in Philadelphia and Reading, Pennsylvania, as well as Boston, Memphis and Los Angeles.
2 Economic segregation affects Black students the most
Economic segregation is also extreme in many metro areas, particularly Newark, Bridgeport, Milwaukee and Chicago, and affects Black students more than other groups. The average Black student attends a school where the rate of students who qualify for free or reduced-price meals is 16 percentage points higher than in the average white student’s school in the same metro region.
3 Private schools are not a leading factor
Private school enrollment is not a driving force behind segregation overall. But there are some areas where it’s a bigger factor, including Sumter, South Carolina, Napa, California, and the New York-Jersey City-White Plains area of New York and New Jersey.
4 Research influenced White House on charters
Potter’s past research on charter schools influenced the Biden administration’s controversial proposal to revamp the federal Charter Schools Program. The plan would discourage the creation and expansion of charter schools in districts that have voluntary integration programs.
The new report, however, shows that charter schools account for just 6% of segregation by income and 4% of white-nonwhite segregation across metro areas.
Get stories like these delivered straight to your inbox. Sign up for The 74 Newsletter