

;)
Apples-to-apples comparisons prove challenging
The UCLA study is descriptive, as researchers would say, meaning it reports the data, rather than explains it.
In this case, the data show that charter schools on average have slightly higher rates of suspension than non-charters: 7.8 percent versus 6.7 percent. This is a small but real difference.
But why does that difference exist? Is it because charter schools are more likely to have zero-tolerance discipline policies? The report can’t really answer these questions, but it does, to its credit, disaggregate the data in a way that helps. In the chart below, we see that when comparing students of the same race in secondary schools, charters suspend higher numbers of students with disabilities, black students and Asian students than non-charters. But charter schools actually have lower suspension numbers for other groups, including Latinos and students learning English. As the report itself says, “Charter schools are not consistently higher-suspending than non-charters for every subgroup, and that, whether higher or lower, the differences between the types of schools are not large.”
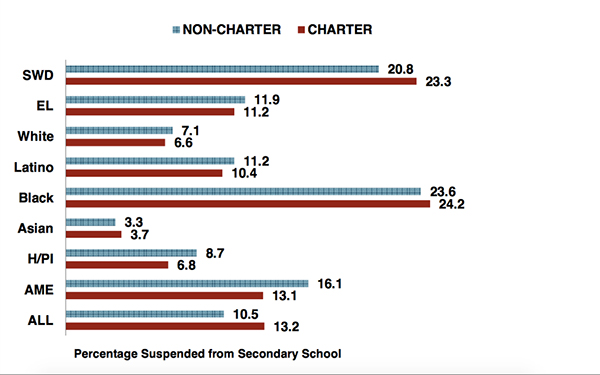
As the report notes, having a certain student population is not a justification for having higher suspension rates, but when trying to understand differences between charters and district schools, it’s crucial to take those factors into account.
Regardless, it is clear that both types of schools have problems with disproportionate discipline for certain student populations. It’s less clear that this problem is significantly worse in charter schools.
Suspension rates can vary based on research approach
Beware media reports that fail to address the limitations of this research
The existing research on discipline is more mixed than the UCLA report suggests
Many districts and charter schools across the country appear to be trying to improve on this front (we’ve covered a few here), but the UCLA report spotlights the fact that schools in both sectors have a long way to go. But policymakers, pundits and the mainstream press should also recognize the limitations of this report, and steer clear of the suggestion that high suspensions rates are a problem unique to charter schools.
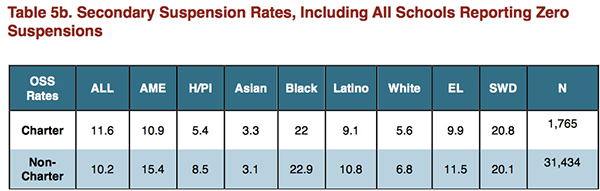
1. Zero is used if the data is missing or incomplete, further complicating comparisons. (return to story)
2. This amount to an exclusion of about 9 percent of non-charters and 17 percent of charters. (return to story)
3. Readers may wonder how it’s possible in this chart that charters appear to have lower subgroup suspension rates than non-charters, but a higher overall suspension rate. This is known in statistics as Simpson’s Paradox. In this case, charters serve student populations — particularly black students — who are more likely to be suspended regardless of whether they attend a charter or non-charter school. This again points to the challenge of making comparisons between suspension rates at charter and district schools. (return to story)
4. Notably, there was no difference in suspensions between Massachusetts’ non-urban charters and district schools. (return to story)