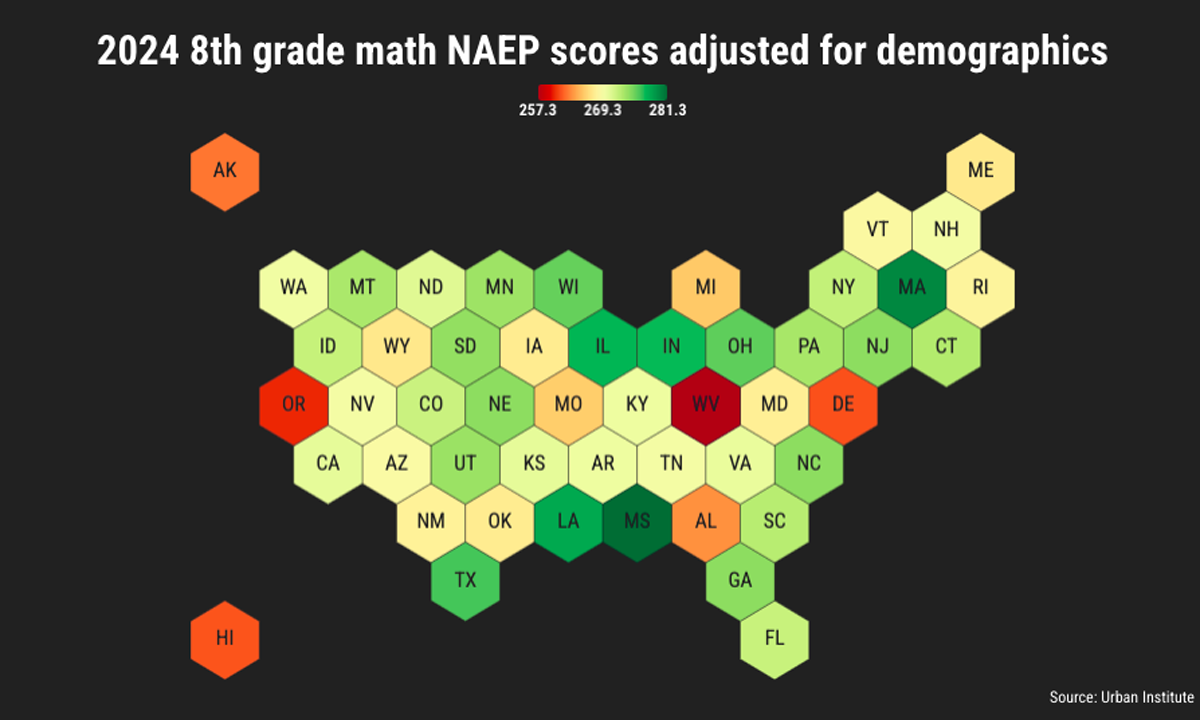
The South Surges Academically in Alternative View of National Exam
The Urban Institute’s demographic adjustments to the Nation’s Report Card reveal a new K–12 hierarchy stretching through the American South.

;)
Untangle Your Mind!
Sign up for our free newsletter and start your day with in-depth reporting on the latest topics in education.
Get stories like this delivered straight to your inbox. Sign up for The 74 Newsletter
Mississippi fourth-graders are the tops in the country at math and reading, surpassing their peers in much wealthier New Jersey and Connecticut, according to an analysis of America’s foremost test of student learning. A raft of other, mostly unheralded states command the peaks of academic achievement, including Louisiana, Florida, Texas, and Georgia.
Those findings emerge out of the latest National Assessment of Educational Progress, often referred to as the Nation’s Report Card. Amid an otherwise-disastrous release of fourth- and eighth-grade scores last month, experts hailed the emergence of a new hierarchy of educational excellence that largely runs through the South.
There’s a catch, however: That revised national leaderboard is visible only after researchers account for the wide variety of student populations in each state. The startling adjustments to the 2024 NAEP were produced by the left-leaning Urban Institute, which has long applied statistical controls to scores in an attempt to develop a more precise understanding of how well schools are teaching children.
At the heart of the effort is an acknowledgment that student demographics are not evenly sorted across state borders. Black students live in disproportionate numbers across the Deep South, while English language learners are much more likely to be found near the Mexican border. Perhaps most prominently, rates of child poverty are much worse below the Mason-Dixon line than above. Higher or lower concentrations of these student groups, which have all historically posted lower NAEP scores, can heavily sway states’ performance in ways that may not accurately represent the quality of their schools and teachers, said Matthew Chingos, Urban’s vice president for education.
Adjusting for demographic traits produces “more of an apples-to-apples comparison” between different parts of the country, he added.
“If you want to go to a random state, ask a fourth-grader a math question, and have the highest chance of them getting it right, you’ll probably be fine going to the place with the most white, high-income kids,” Chingos said. “But if you want to randomly place a kid in the state where he’ll learn the most, then this list is a better approximation of that.”
To reach that approximation, Chingos and co-author Kristin Blagg used NAEP’s national data to compare test takers in each state directly against those of the same age, gender, race, socioeconomic background, special education status, and English language learner designation. These calculations effectively simulate a world in which Hispanic students, for example, are as plentiful in Maine as in Arizona.
The consequent shifts are surprising.
In NAEP’s raw (statistically unweighted) scores for fourth-grade math, the one subject in which American students made significant gains over the last two years, the top 10 states were Massachusetts, Florida, Wyoming, New Hampshire, Utah, North Dakota, Minnesota, Texas, and New Jersey. But only four of those (Florida, Massachusetts, Texas, and Indiana) remained among the top 10 in Urban’s estimates. Strikingly, New Hampshire and North Dakota actually fell to the 11th- and 12th-worst in the country after controlling for demographics.
The states that get adjusted up love this. The states that get adjusted down ignore it.
Matt Chingos, Urban Institute

Inter-state contrasts can be even more stark. New Jersey eighth graders earned an average reading score of 266 second-best in the U.S.), while their peers in Arkansas scored 255 (tied for tenth from the bottom). In Chingos and Blagg’s report, however, the two states are nearly identical.
Among all states, Urban measured Mississippi — which underwent a much-celebrated academic revival over the past decade — as receiving the highest adjusted scores in fourth- and eighth-grade math, as well as fourth-grade reading. It nearly grabbed the top spot in eighth-grade reading for good measure, finishing just behind Massachusetts, Louisiana, and Georgia. A full set of adjusted rankings (illustrated and disseminated on Twitter by education advocate Marc Porter Magee) also placed Texas, Indiana, Florida, South Carolina, Illinois, and Kentucky among the top states after averaging all four age/subject combinations.
Carrie Conaway, a senior lecturer at Harvard who previously served as chief research officer at Massachusetts’s state education agency, said that both raw and adjusted scores provide an important lens on the true extent of learning. But when local leaders want to benchmark their results against other states’, she added, Urban’s release is “the only way to do it.”
“It’s not that one measurement is better than the other, it’s that each question comes with a different set of assumptions and conclusions you could draw,” Conaway said. “But I do think that more people are interested in the question of whose system is the best, independent of demographics.”
A matter of perspective
The unavoidable reality is that states must educate the students who actually enroll in their schools. No amount of empirical maneuvering will change those headline numbers.
Yet Urban’s alternative perspective undoubtedly reflects some authentic improvements in school outcomes. Not only did the adjusted scores for Louisiana rank second only to Mississippi, the state also saw some of the fastest-growing raw scores on the 2024 round of NAEP — including the only significant ascent in elementary literacy anywhere in the United States since 2019.
Those strides have accompanied the implementation of a wide-ranging overhaul of reading instruction that was consciously modeled after strategies first adopted by Mississippi. But it is difficult to identify which factors led directly to better achievement, Chingos said, arguing that any theories about how learning gains were accomplished would have to allow for the fact that states “have done a whole bunch of things over a long period of time.”
“In Florida, was it the expansion of school choice, the reduction of class sizes, or something else? In Massachusetts, was it all the money that was spent or the strength of teachers’ unions? You seldom see a clean story like in Mississippi, where they did a big overhaul of reading instruction, and they saw reading scores go way up,” he said.
Some also question the importance of rankings themselves. Derek Briggs, a professor at the University of Colorado Boulder who specializes in student evaluation, said that he was more interested in examining the rise or fall of scores over time rather than states’ comparative positioning on a list. Adjustments like Urban’s have value as a way of delving into the results of a one-time exam, he continued, but they are ultimately less useful in the context of NAEP, which tracks each state’s performance going back to the 1970s.
“If the perspective you’re taking is to look at trends and change over time, then in some sense, it doesn’t matter that certain states begin in different positions,” said Briggs. “Yes, you can see that the states are in different spots in the original year, but what you really want to focus on is the change.”
Chingos conceded that top-down ordering is “always a little weird,” particularly in the middle of the rankings, because changes of just a point or two in either direction can meaningfully alter how states perceive and present themselves. While he and his colleagues try to communicate the complex ways in which academic reality can be obscured by demographics, the response of state leaders is typically more predictable.
“The states that get adjusted up love this,” he said. “The states that get adjusted down ignore it.”
‘We take seriously our role as leaders’
Few will have the option of ignoring the decline in student learning over the last decade, which worsened dramatically during the COVID era. According to a district-level study of the NAEP results conducted by researchers at Harvard and Stanford, just 6 percent of American students live in school districts where math and reading levels are higher than they were in 2019. And the damage is worst in areas with large numbers of minority and low-income students.
With the end of pandemic relief aid from Washington, states are attempting to launch an academic recovery that will accelerate growth for the kinds of student populations that feature prominently in the Urban Institute’s analysis. While their paths to improvement may not be easy to emulate, top-scoring states provide a model for stragglers.
John White served as Louisiana’s superintendent of education between 2012 and 2020, when local schools — historically some of the lowest-performing in the country — made significant headway. In an interview, he said he believed that states like Louisiana were able to reach disadvantaged student populations through assertive K–12 oversight led by governors, legislatures and state education agencies. Many others embodied a more “passive” approach that largely centered on dispensing resources to schools and districts, he argued.
“If you look at the states at the top of the Urban Institute list, you would have to say that it’s almost synonymous with those that have said, ‘We take seriously our role as leaders of classroom- and school-level change, and we don’t see ourselves just as rule makers and check writers,’” White observed.
While significant differences exist among successful school systems, White said, the unifying element is usually a leadership class that willingly embraces its role as a guarantor of student success. Those responsibilities extend to the selection of high-quality curricula, the provision of teacher training in domains like the science of reading, and the maintenance of high standards and accountability for schools and teachers.
In a recent essay, literacy advocate Karen Vaites specifically cited Louisiana, Tennessee, Mississippi, and Alabama as beacons of reading growth for the rest of the country to follow. White agreed the region has gained momentum in recent years, adding that the “golden age” of education reform was largely driven by Southern governors like Bill Clinton in Arkansas, Jim Hunt in North Carolina, and the Bush brothers in Texas and Florida. Along with strong state leadership, he said, particular features like unelected state superintendents and county-level school districts likely explain some of their progress.
To policymakers in states that have struggled to boost student success, and particularly those whose NAEP scores fall after demographic adjustments, he recommended that the challenge be “taken seriously.”
“If you’re the state chief in a place like that, the question in front of you is how to use the tools you have to systematize a long-term approach to change,” he concluded. “I don’t see any evidence — and Massachusetts has proven so for decades — that you can’t systematize improvement over multiple years.”
Get stories like these delivered straight to your inbox. Sign up for The 74 Newsletter