

;)
Untangle Your Mind!
Sign up for our free newsletter and start your day with in-depth reporting on the latest topics in education.
This essay originally appeared at Flypaper.
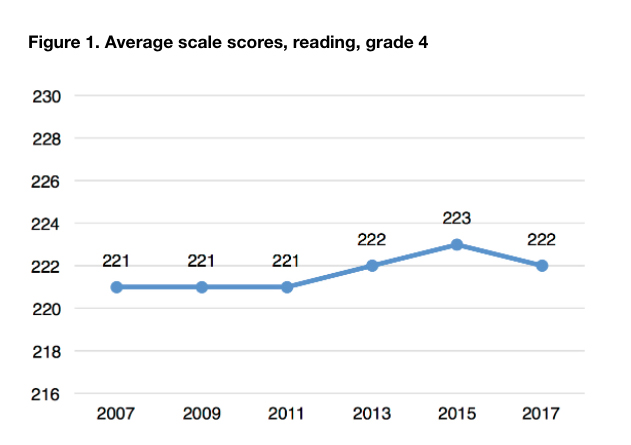
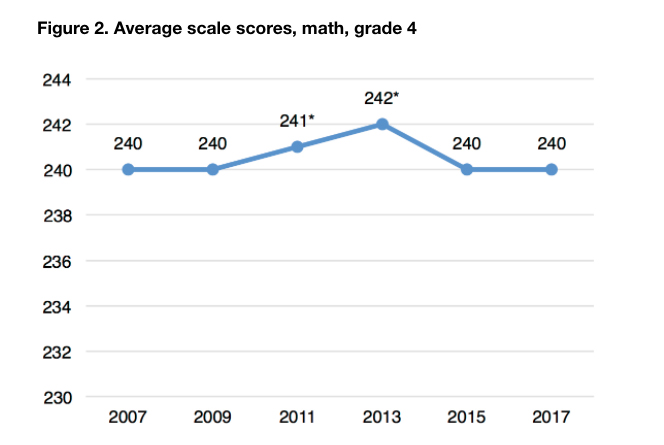
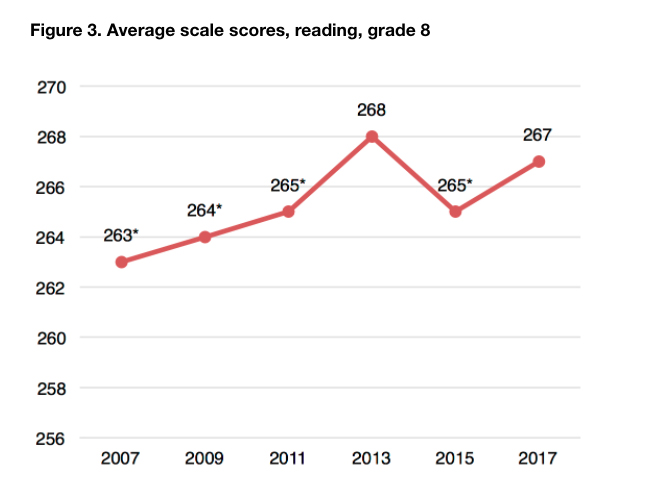
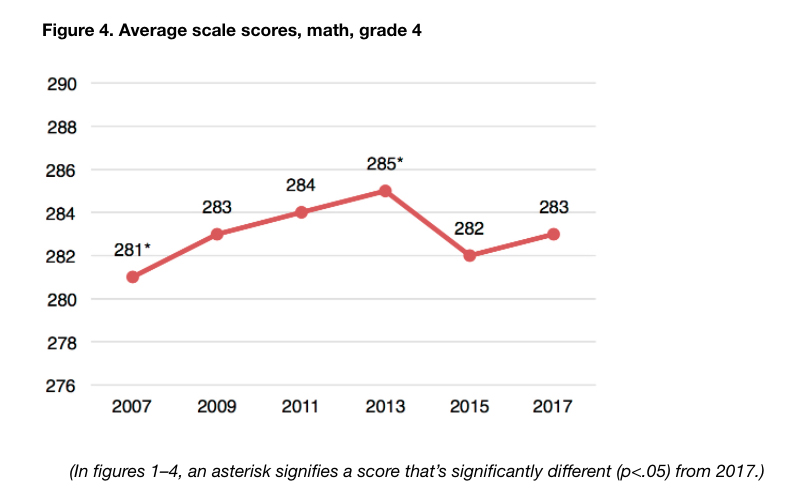
As feared, the new results from the National Assessment of Educational Progress show that national trends are mostly flat.
Coming on the heels of some modest declines in 2015, the 2017 scores amount to more bleak news. It’s now been almost a decade since we’ve seen strong growth in either reading or math, with the slight exception of eighth-grade reading.
There’s no way to sugarcoat these scores; they are extremely disappointing.
The obvious question is why, and that’s something that NAEP can’t tell us. (Indeed, it’s NAEP’s job to give us the facts, not the underpinning explanations.) We can certainly identify hypotheses, but it’s going to take some time for scholars to gain access to restricted-use data and crunch the numbers to determine which hunches, conjectures, and justifications may hold water. Among the possibilities that make the most sense to me: the Great Recession, which negatively impacted school spending and also the home lives of a number of children, and the backing away from test-based accountability, with NCLB waivers followed by an “accountability pause” in many states as we transitioned to the Every Student Succeeds Act.
But let’s not get ahead of ourselves. Before we get to the “why,” let’s look at the “what”; let’s dig into the seven storylines I suggested last week. As I’ve been arguing for a while now, we should look at results over at least four years; examine subgroups and not just averages; and check for statistically significant changes at the national, state, and local levels.
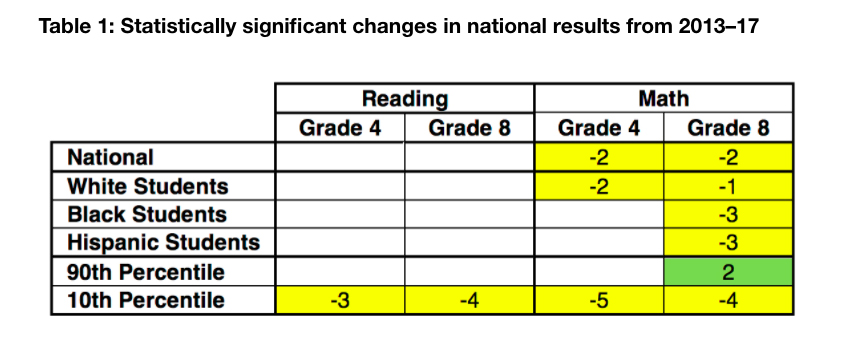
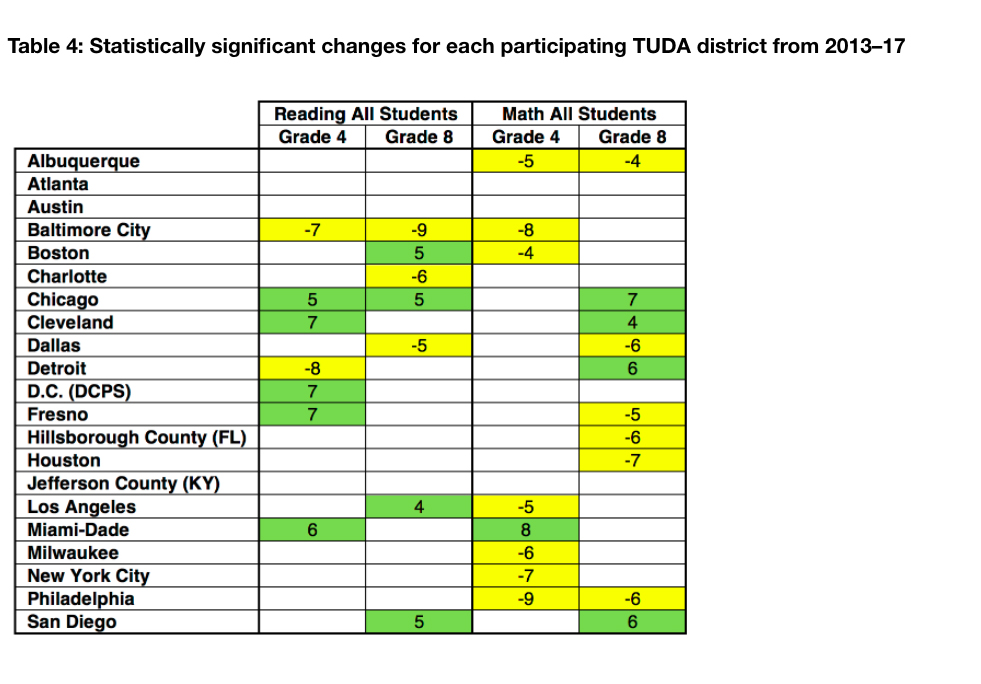
1. Over the past four years, national trends are mostly flat in reading and down slightly in math. These trends hold up when looking at racial subgroups, too, so we can’t blame the changing demographics of the student population. The scores of our lowest-performing students have declined across the board, though there’s good news for our highest-performing children. (Boxes in green show statistically significant increases; boxes in yellow show statistically significant declines; and empty boxes show no statistically significant changes.)
 2. The switch to tablet-based testing is raising questions about state and local scores. The methodological debate goes way over my head, but it does appear that some of the states with the lowest-performing and most disadvantaged students saw the biggest declines in their fourth-grade scores, perhaps because these kids struggled with the tablet-based test. And several states that don’t mandate online testing for their own annual assessments — including Kentucky, Louisiana, North Carolina, Oklahoma, South Carolina, and Tennessee — did the worst. On the other hand, if the Great Recession helped to drive down scores, that could also explain why poorer states (and districts) are doing worse.
3. The shine isn’t off the Washington, D.C., apple quite yet. Both as a “state” and as a “district,” D.C. saw its scores remain flat from 2015 to 2017, the first time D.C. didn’t see an increase in many years. But if we examine 2013–17, the Capital City still ekes out statistically significant increases in some categories. Let’s see how it looks for everyone, starting with the states.
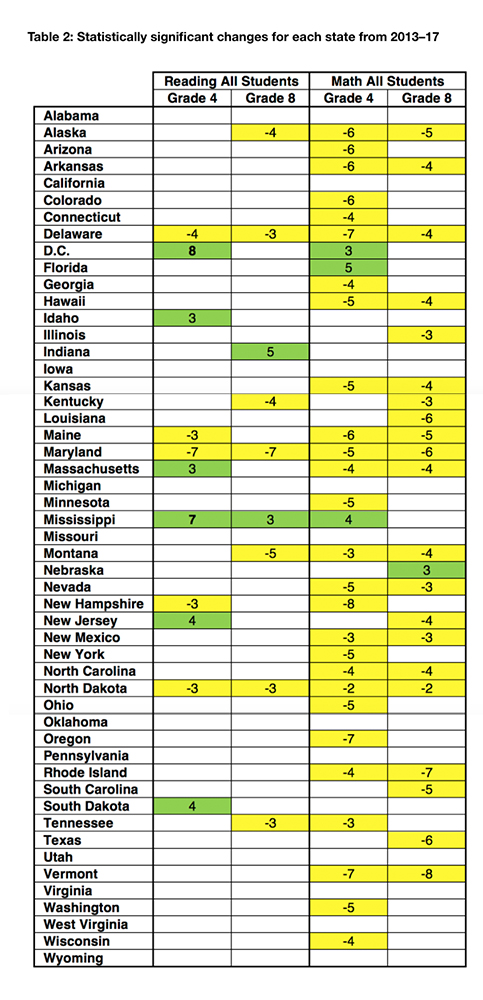
That’s not a particularly pretty picture, especially in math. Some highlights:
- Seven states saw statistically significant gains in reading in either fourth or eighth grade from 2013 to 2017; only Mississippi saw increases in both grades.
- Nine states saw declines in reading in one or both grades, including three that declined in both (Delaware, Maryland, and North Dakota).
- Just four states made statistically significant progress in math in at least one grade (D.C., Florida, Mississippi, and Nebraska).
- An astounding 33 states saw declines in math in at least one grade; 15 saw them in both grades.
- Delaware, Maryland, and North Dakota saw declines across the board.
Now let’s examine subgroups for each state:
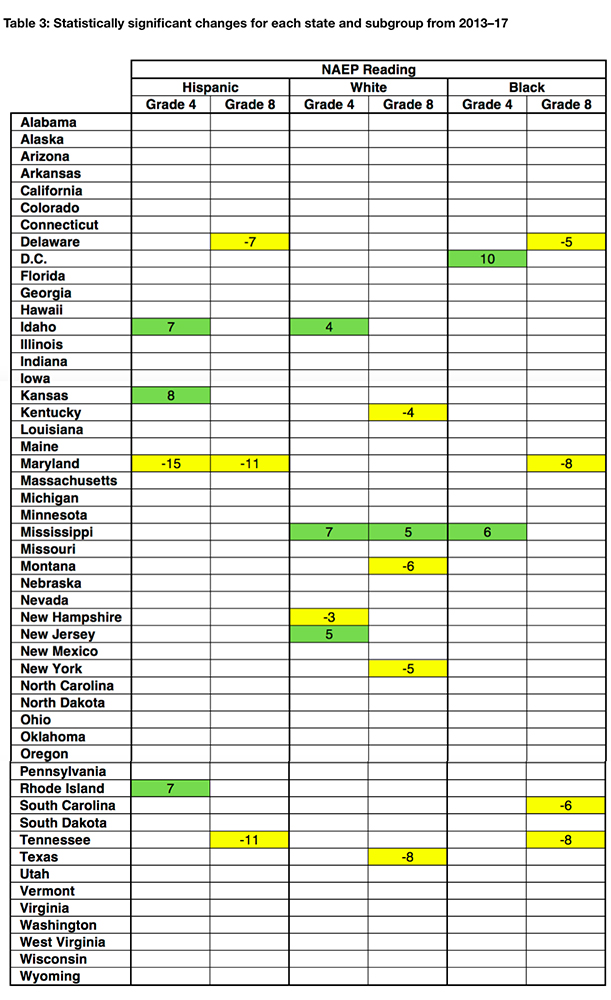
The subgroup results don’t change the basic picture, but there are a few noteworthy items:
- In reading, Idaho, Kansas, New Jersey, and Rhode Island made it onto the board for gains in at least one category.
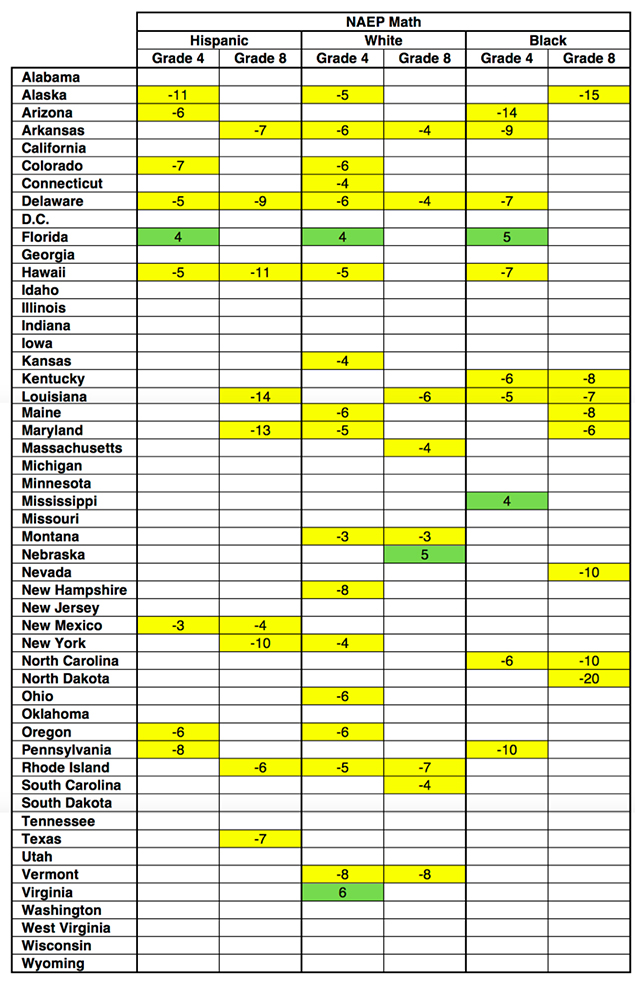
- Mississippi’s reading gains and Florida’s math gains are impressively widespread.
- There’s no hiding from the wall-to-wall math declines in Alaska, Arkansas, Delaware, Hawaii, Louisiana, Maryland, and Rhode Island.
Now let’s turn to the big urban districts that participated in both 2013 and 2017:
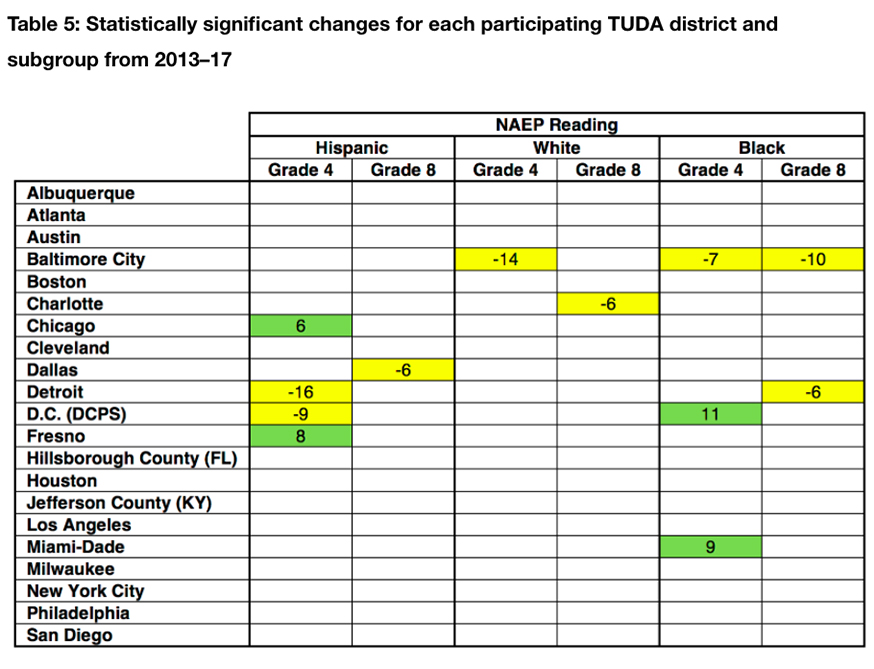
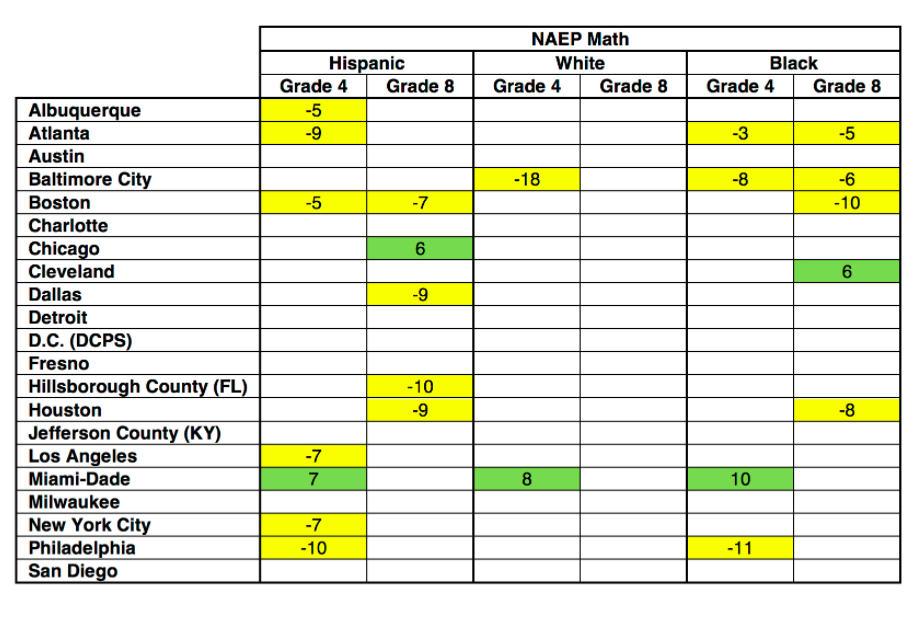
And by subgroups:
Now back to our storylines.
4. Is Indiana still an “Ed Reform Idol”? As with D.C., just barely. It stays in positive territory with statistically significant gains in eighth-grade reading, but otherwise its scores from 2013 are flat. Same with subgroup scores. The Hoosiers look like they may be hitting a plateau.
5. Fiesta forever in Miami? On the other hand, Alberto Carvalho’s Miami-Dade keeps racking up gains, with statistically significant improvements for fourth-graders in both reading and math. The across-the-board gains in fourth-grade math are especially impressive.
6. Are Chicago’s 15 minutes of fame over? Not yet. The city made progress in three of four categories overall, though the gains at the fourth-grade level will make its “cohort gains” (from fourth to eighth grade) less impressive. It looks like Chicago is doing particularly well by its Hispanic students.
7. Is the “California Way” working? Perhaps, but only by standing still. Remarkably, there’s not a single statistically significant change — either up or down — for either subject or grade level, or for any subgroup in California. It is flat as a pancake. Given that most other states are moving backward, it looks pretty good by comparison. But that shouldn’t be enough to satisfy its leaders. And if we want to look for another state to chase, it should be the Sunshine State, not the Golden State. Or — and get ready for some humble pie — Mississippi!
There is plenty more to unpack. Who lost Boston, for example? What’s the story with Philadelphia? And why isn’t Atlanta so hot? Scholars will be digging into restricted-use data in coming days and weeks; if they find anything, we’ll share it with you here. In the meantime, let’s start discussing the most important question: What can we do so that these flat lines turn into upward slopes again, and before it’s too late for our current generation of students?
Get stories like these delivered straight to your inbox. Sign up for The 74 Newsletter
Michael J. Petrilli is president of the Thomas B. Fordham Institute, a visiting fellow at Stanford University's Hoover Institution and an executive editor of Education Next.