Opinion: State Union Rankings Show Strength of Labor Depends on Size of Government

;)
Education news and commentary, delivered right to your inbox.
Sign up for The 74 newsletter.
Mike Antonucci’s Union Report appears Wednesdays; see the full archive
The public sector workforce is only about one-sixth the size of its private sector counterpart, but public sector workers are much more likely to be unionized: Public and private unions have about the same number of members. With private sector unions only about half the size they were in 1979, the strength of labor has become dependent on the size of governments.
All unions profess to stand in solidarity with each other, but public and private sector unions have some signal differences. Private sector unions have to consider the financial health of the companies their members work for in a way that public sector unions do not. Governments don’t go out of business, or move to another state, or move overseas. And private sector unions don’t select their members’ employers. Through political support and campaign contributions, public sector unions can choose the people who decide how many government employees will be hired.
The composition of the workforce, and of unions that make up part of the workforce, help make sense of a state’s labor policies. With that in mind, I constructed a simple table that provides three figures for each state: 1) public sector workers expressed as a percentage of the total workforce; 2) public sector union members expressed as a percentage of total union membership; and 3) a “strength score” assigned by combining the two figures, giving them equal weight, and referencing them to a national average score of 100.
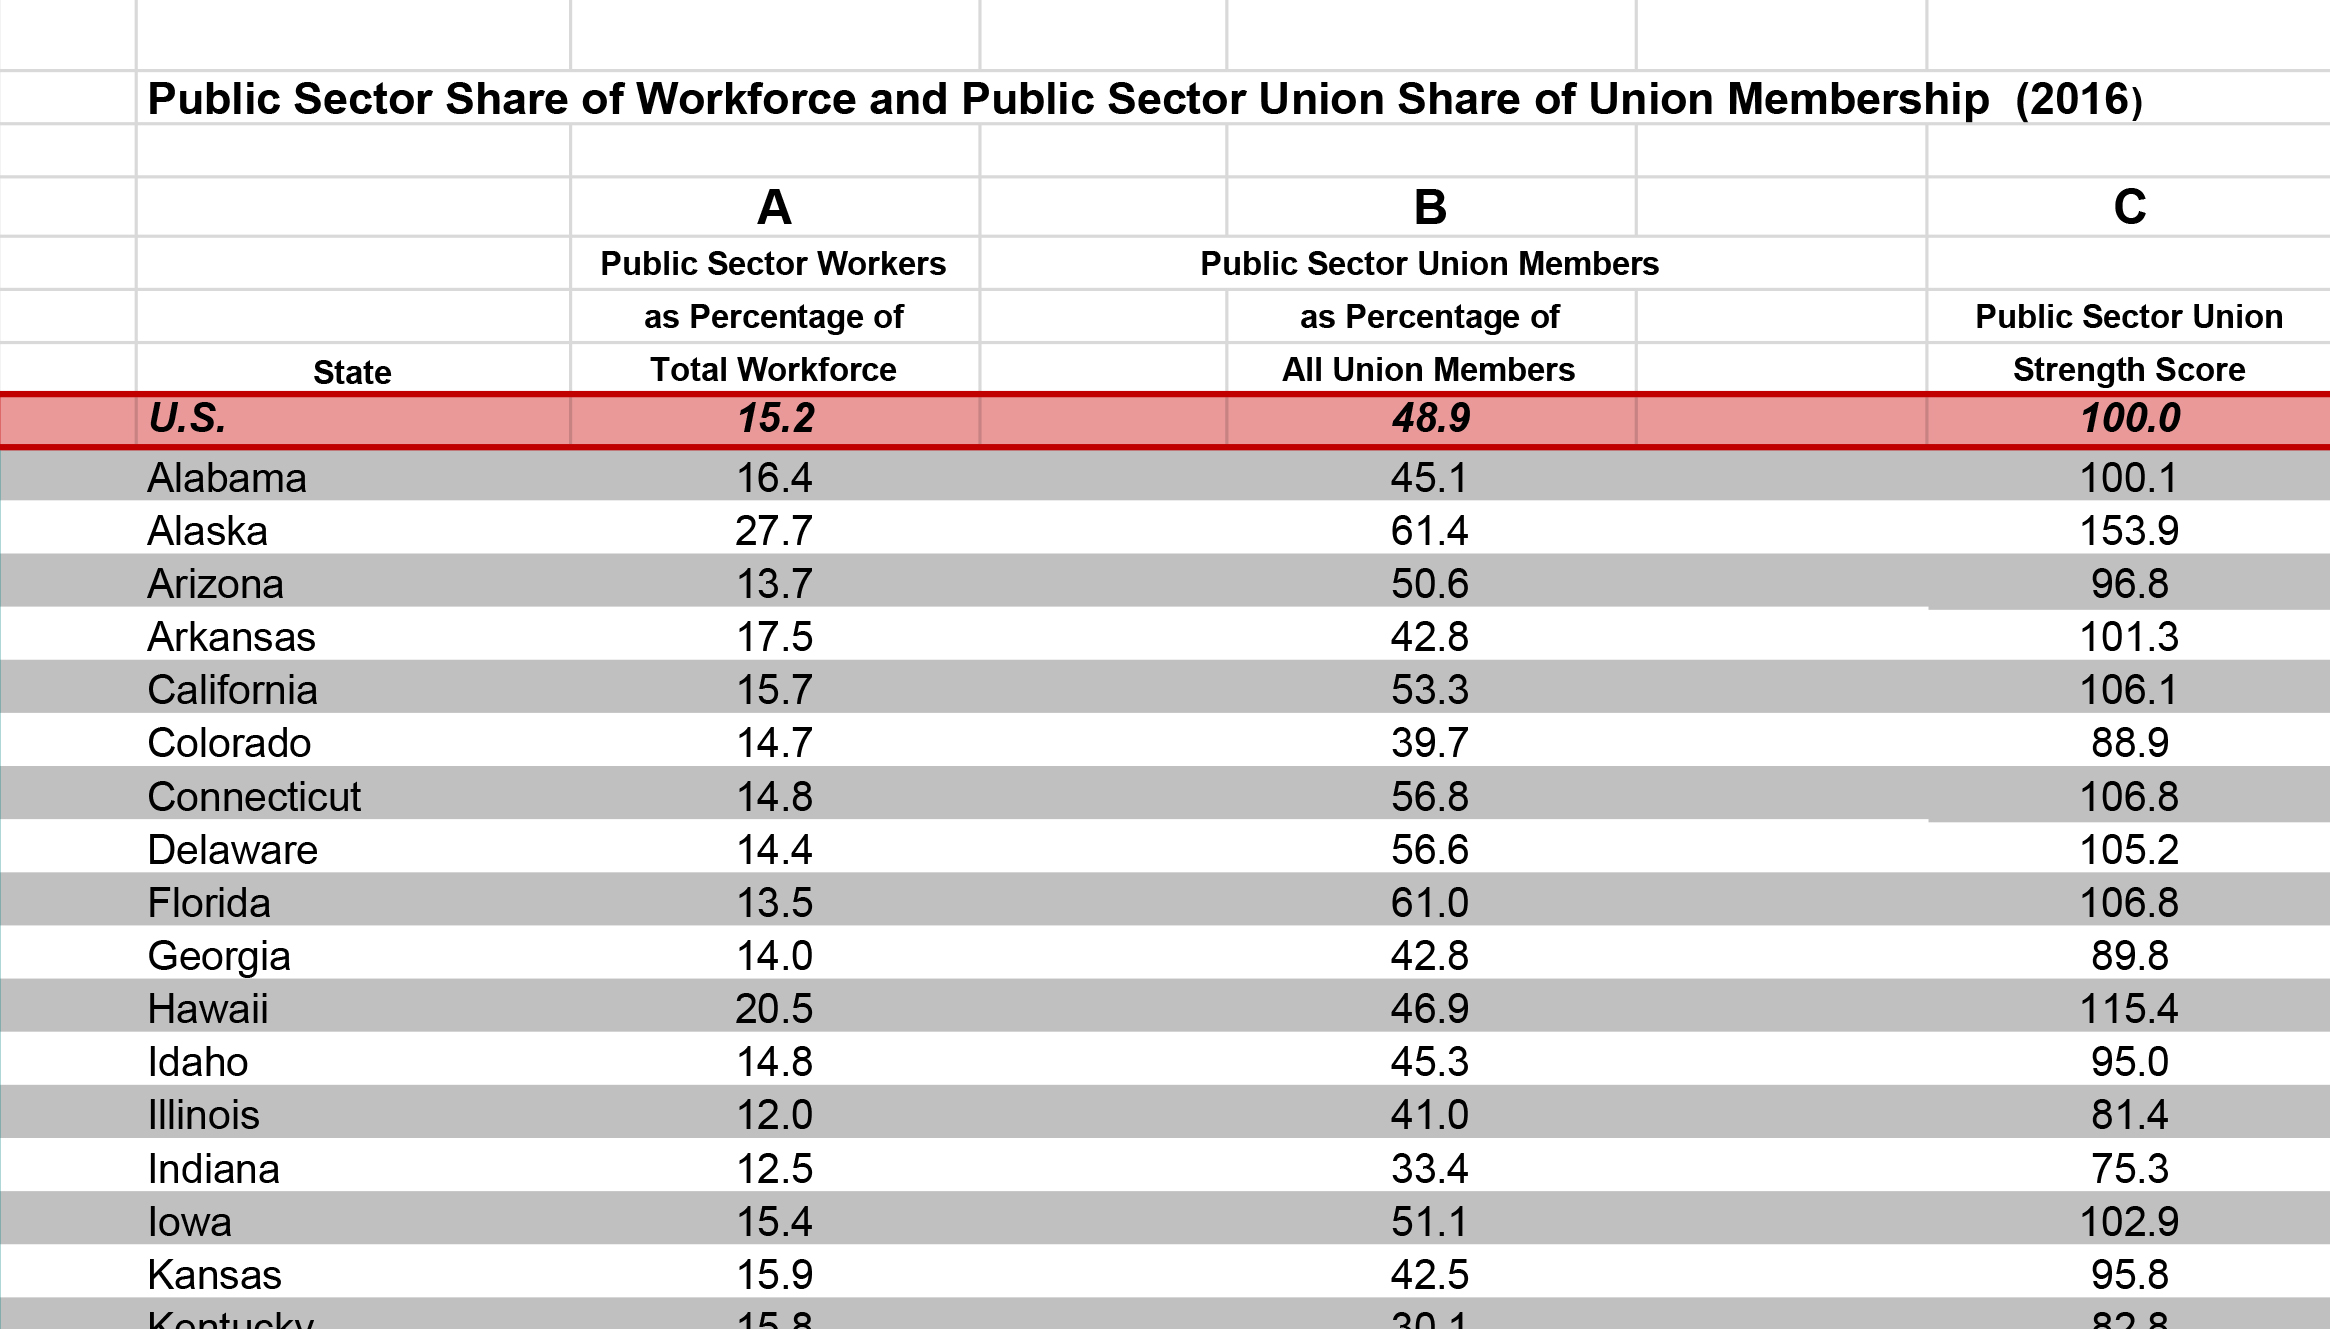
The first column tells us how much of the available workforce in a state is devoted to government operations. A high number (as in Alaska, Wyoming, Washington, D.C., and Maryland) indicates that relatively more resources are devoted to public sector staffing. This could be due to policies that have led to expanded government services, or a relatively weak market for private sector employment. A low number (as in Pennsylvania, Illinois, and Michigan) suggests the opposite — less of a priority placed on government services, greater employment needs in the private sector, or a combination of the two.
The second number defines the relative strength of public sector unions compared with private sector unions. While this is close to 50–50 nationwide, the percentages differ widely from state to state.
A low number here (Kentucky, Nevada, Missouri, Indiana) suggests a state where either recruiting for public sector unions is difficult or private sector unions thrive. A high number (New Hampshire, Maine, New Mexico) suggests states where the opposite is true.
Combining these two figures together gives us a sense of the strength of public sector unions in each state. To give them equal weight, I multiplied the national averages so they’d each equal fifty, then multiplied each number in the columns by the same amount. Adding those together made the national benchmark 100 and all the other figures increased proportionally. The highest numbers went to states where government employees comprise the largest percentage of the workforce and the largest percentage of union members.
By this measure, public sector unions in five very dissimilar locations — Alaska, New Mexico, Maryland, Washington, D.C., and Wyoming — have very similar characteristics when it comes to the strength they have relative to the rest of the workforce and private sector unions.
Conversely, public sector unions in Nevada, Indiana, Missouri, and Michigan have less relative strength when compared with other labor interests in their respective states.
Nationally, teachers unions make up about half the membership of all public sector unions. Once I have the 2016 numbers in hand, I may amend this table to indicate the relative strength of each NEA affiliate within a state.
I should emphasize that the scores are not meant to compare states to each other. Nevada is still a strong union state, but these numbers show that that is mostly due to its private sector unions. New Mexico is still a weak union state, but its public sector unions are the lone voice for labor.
These numbers give us a sense of which states have unions that are more dependent on the private economy for their strength, and which are more dependent on government policies. The effects of one can improve or hinder the fortunes of the other, making the interplay of labor relations a delicate task for legislators, public administrators, and private employers.
Get stories like these delivered straight to your inbox. Sign up for The 74 Newsletter