North Carolina DPI Wants School Grades to Better Reflect School Performance
The new model presented to lawmakers aims to tell parents and the public more about the quality of each school.

Get stories like this delivered straight to your inbox. Sign up for The 74 Newsletter
State Superintendent Catherine Truitt presented the Department of Public Instruction’s (DPI) proposal for school performance grade redesign to lawmakers on Monday during a House education reform committee meeting.
To move forward, the model requires legislative action.
“The new proposed model… aims to tell parents and the public more about the quality of each school and how it is preparing students for life after graduation, rather than solely reflecting student performance on high-stakes testing,” DPI said in a press release.
Currently, school grades are based on each school’s achievement score, weighted 80%, and on students’ academic growth, weighted 20%. Education leaders say that formula does not capture the full picture of the work happening in our public schools. DPI’s presentation said national data “affirms North Carolina schools are performing considerably better than their state performance grades otherwise suggest.”
“We have to do more than simply look at test scores that occur on one day of the year at the end of the year or semester,” Truitt said. “We must absolutely be as transparent as possible about the percentage of students who are proficient in reading and proficient math, but there has to be more than that.”
The proposed model include developing “a multi-measure model of school performance that moves beyond compliance with federal guidelines and represents NC educational values,” per DPI’s presentation.
Under DPI’s proposed model, presented on Monday, schools would receive four different grades. Those four grades, listed below, would not be combined into one single letter.
- Academics. Across all grades, this would measure proficiency in math, science, and reading.
- Progress. This grade would measure a school’s growth, based on EVAAS data.
- Readiness. Across K-12, this grade would measure postsecondary preparation. In middle school, it would also include career development plans. In high school, it would also include postsecondary outcomes and graduation rates.
- Opportunity. This grade would measure chronic absenteeism, school climate, and intra/extra curricular activities.
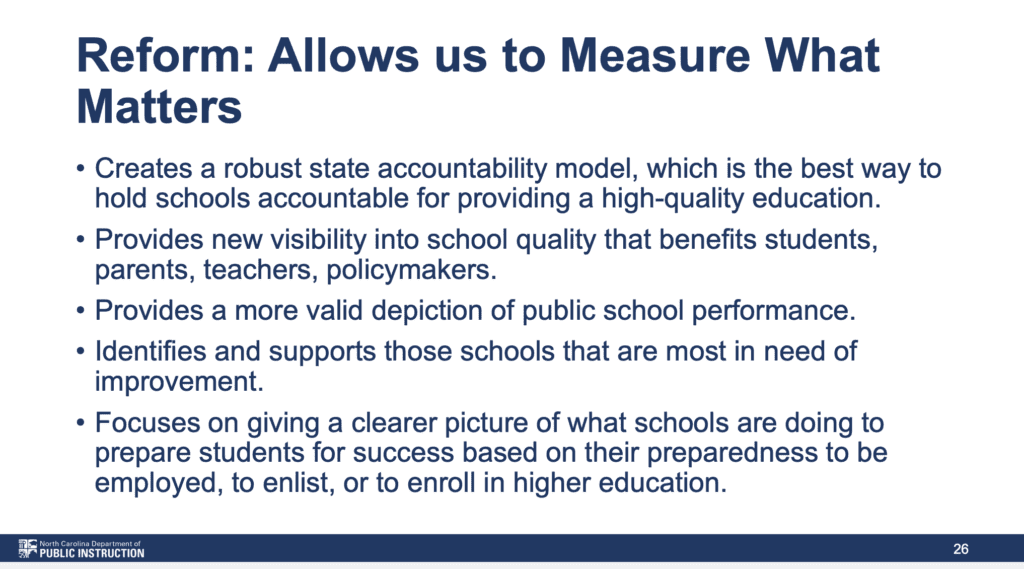
“Instead of one performance grade, we have four,” Truitt told lawmakers. “This proposal creates a more robust state accountability model. That is the best way for holding schools accountable for providing a high-quality education.”
DPI convened a working group to redesign the accountability model in fall 2022. That work included input from a survey by EdNC. After unveiling eight possible new indicators in January 2023, working groups began meeting in May to refine each indicator. Those groups met through October.
DPI is asking for lawmakers to enact legislation allowing for a voluntary pilot to begin during the 2024-25 school year. In Year 2, all school districts would participate in both models, with support from DPI. In Year 3, only the new accountability model would be used.
Because the state already tracks school achievement and growth data, Truitt said no changes would need to take place for the first two measures. However, DPI would need to create new tracking systems for postsecondary preparation indicators and outcomes and intra/extra curricular activities.
More information about the DPI advisory group’s work is available on DPI’s website.
How we got here
Current school performance grades were first reported in February 2015 based on 2013-14 school year data, EdNC previously reported.
School grades are based on achievement through test scores (80%) and growth (20%) and are assigned as follows:
- A = 100–85
- B = 84–70
- C = 69–55
- D = 54–40
- F = 39 and below
According DPI’s presentation on Monday, 46.5% of elementary schools were “D and F schools” in 2021-22. More than half of middle schools (52%) and 23% of high schools received the same designation in that time period. K-8 school grades are limited to test score results, contributing to the higher number of low-performing schools. You can view school performance grades for the 2022-23 school year here.
“A large proportion of our schools is low performing,” Dr. Michael Maher, DPI’s deputy state superintendent, said on Monday. “As we think about this problem, one of the first steps we took was to say, ‘Well what does it look like across the country?’”
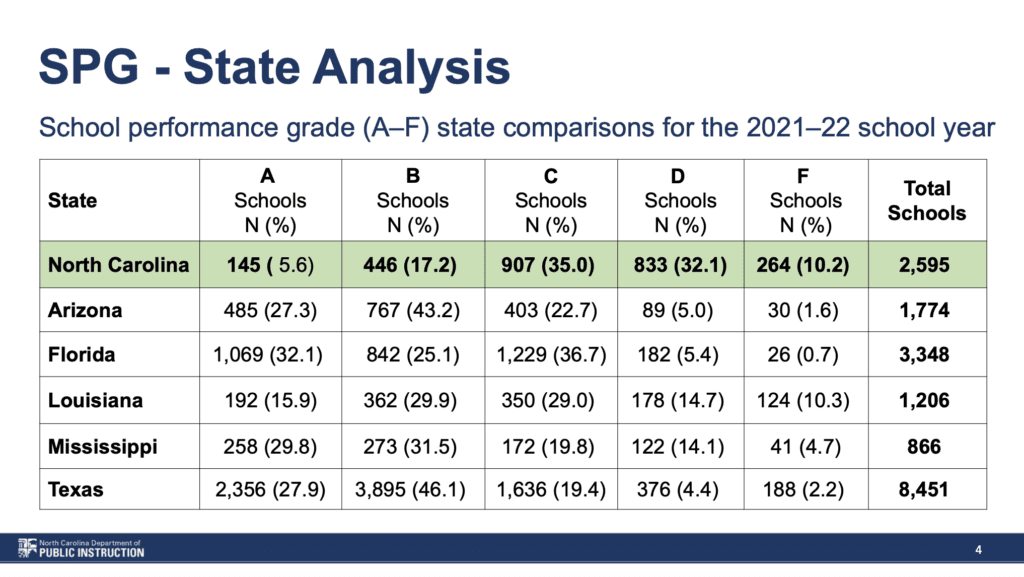
Based on school performance grades alone, North Carolina schools are performing worse than several other states, DPI said.
Here’s a look at North Carolina’s school performance grades in 2021-22, compared with scores in Arizona, Florida, Louisiana, Mississippi, and Texas. This data is the same data Truitt presented to lawmakers in May.

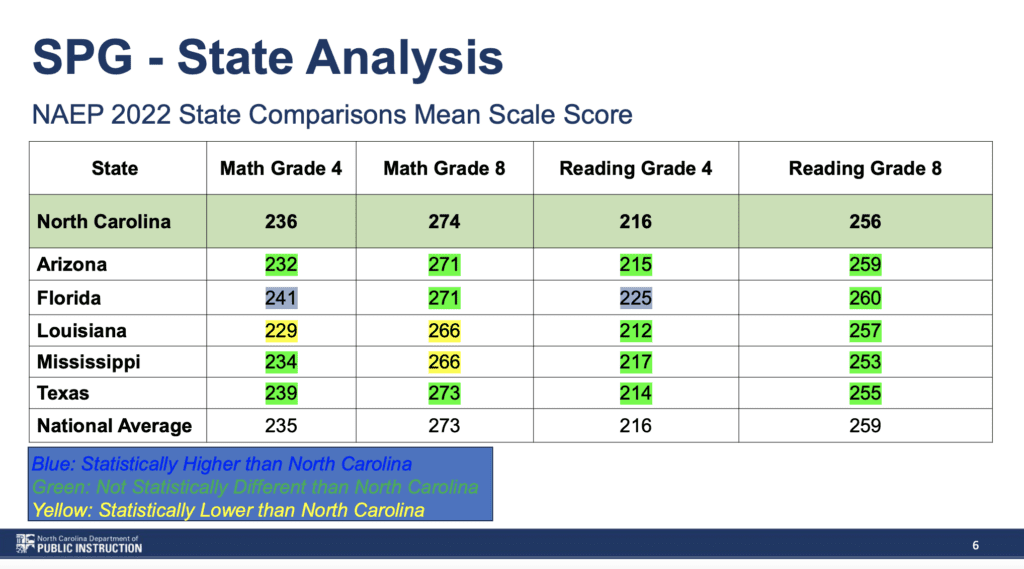
However, if you look at National Assessment of Educational Progress (NAEP) scores in each state, DPI said North Carolina is performing much better than its school performance grades suggest. Here is a look at those comparisons:

Maher said this disproportionate number of low-performing schools in North Carolina suggests a problem with the accountability model.
“We’ve set up a system that is no longer valid,” he said. “How do we then as a state, revise this system in a way that it becomes more representative of not only our evolving priorities in North Carolina and addresses the needs of stakeholders, but is also valid and reliable?”
Truitt said the current formula is only part of the problem. Another challenge is that the same data results in two different designations at the federal and state level. That lack of alignment between models makes it difficult to ensure school improvement plans are carried out, Truitt said, or that they are working.
Per DPI’s presentation, such designations also don’t currently result in much funding. That can make it difficult for schools to implement required improvement plans.
“The result is well intentioned but provides ineffective support for principals, educators, and ultimately students,” the presentation said.
DPI’s proposed model would allow the state to measure what matters, she said. In the future, she said, this model would also allow DPI to better use state dollars to assess and support schools.
The proposed model generated bipartisan discussion from lawmakers. Among other things, lawmakers asked about how to increase the capacity to assist low-performing schools, mental health of students, and the use of the Teacher Working Condition Survey.
Rep. Tricia Cotham, R-Mecklenburg, asked how the model would support teachers and principals. Cotham, who switched parties last April, previously served as an assistant school principal and educator. She also asked how the “readiness” measure would account for the quality of success, rather than just the number of students who enroll, enlist, or employ.
Truitt said the new model would help schools start to address both.
“I have not asked this body for money to support low-performing schools to date, and this is exactly why,” Truitt said. “We have to fix this before we can come to you and say, ‘We need X amount of dollars in personnel who can go in and support low-performing schools.’ So eventually we would come back for an ask.”
In May, a bipartisan group of lawmakers expressed support for the model, and asked questions about the impact of chronic absenteeism, school discipline, and the accountability models that other states use.
“The accountability model drives what gets done in a school and what gets prioritized. Right now, we are only prioritizing high-stakes, one-and-done testing,” Truitt said last May. “While it is important to be public about how our students are doing in reading and math and science and their proficiency rates and those teacher growth rates, there’s so much more that we need to be transparent about.”

More from the committee
The House select committee on education reform also heard two other presentations on Monday.
Alexis Schauss, DPI’s chief financial officer, gave a presentation on charter school funding. There are currently 211 charter schools in North Carolina, per that presentation, making up 10% of the state’s allotted Average Daily Membership.
Asheboro City Schools Superintendent Dr. Aaron Woody also gave a brief presentation on the school district.
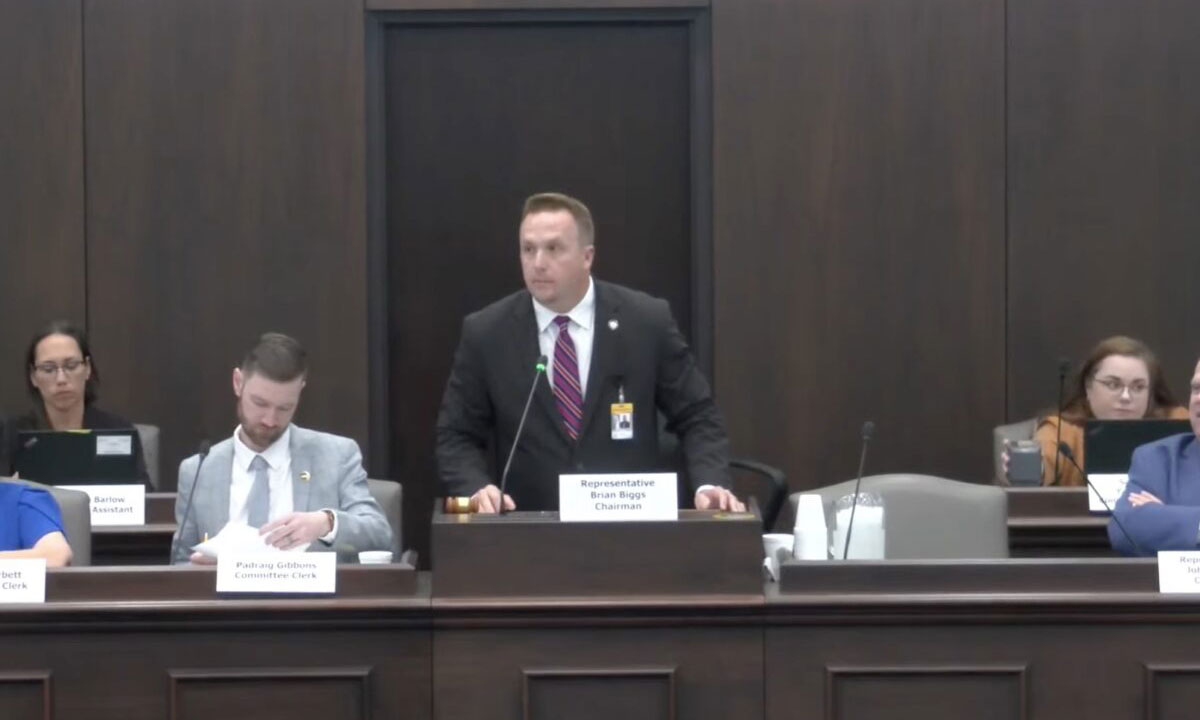
Committee Co-Chair Rep. Brian Biggs, R-Randolph, praised Woody’s leadership at the beginning of his presentation — noting that Woody formerly served as his children’s principal.
Among other things, Woody highlighted the district’s new welcome center, growth in the number of students credentialed, and the system’s mission.
“I was thinking about our why — why we do what we do, why you do what you do here in this chamber, talking about public education and why it matters,” he said. “It matters for each and every one of the 4,600 students that are in my school district for the staff and the parents that are represented, and for the students all across our state.”
This article first appeared on EducationNC and is republished here under a Creative Commons license.
Get stories like these delivered straight to your inbox. Sign up for The 74 Newsletter

;)