New Requirement to Publish Per-Pupil Spending Data Could Help Schools Direct Funding to the Neediest Students. But Even in the Face of Budget Cuts, State Implementation Lags

When the Tennessee Department of Education released school report cards in June, it included per-student spending data for every school in the state — a federal requirement intended to demystify complex budget data that has long been out of reach for parents.
Done well, experts predicted, the change had the potential to draw more parents into conversations about how schools spend money, particularly on their most vulnerable students.
But in September, when it came time to update the report cards, the financial data was gone — due, according to Tennessee Department of Education spokeswoman Victoria Robinson, to pandemic-related delays.
To Gini Pupo-Walker, state director of The Education Trust in Tennessee, an advocacy organization, the timing was unfortunate.
A school-by-school breakdown would not only help schools prepare for impending budget cuts, but could help leaders direct additional funds if Congress eventually passes another pandemic relief bill, she said.
“If we’re going to have cuts to our budget, can we do it in a way that least impacts districts with the highest poverty?” asked Pupo-Walker. She had planned to create a brief summary showing parents how to use the data along with information such as achievement trends, poverty levels, attendance and graduation rates.
“It’s very hard to imagine releasing that fact sheet if you can’t point people to their school’s report card,” she said.
The Every Student Succeeds Act, which became law in 2015, required states for the first time to add per-student funding to their school report cards rather than districtwide averages that tended to obscure funding imbalances between similar schools in the same community. The requirement, which went into effect this year, “has created a whole new lens into how money is spent and allocated in schools,” said Jim Cowen, executive director of the Collaborative for Student Success, a nonprofit focusing on academic standards and assessments.
One school receiving more money than another doesn’t necessarily mean their services are inequitable, but parents can now see, for example, whether a school with more special education students or English learners receives more resources. The new requirement can also show how much is being spent on administration or instruction, allowing parents to see whether schools with the greatest needs have teachers with more or less experience.
The problem is that not all states are displaying the data in “ways that are meaningful and actionable to communities,” according to this year’s Show Me the Data report from the Data Quality Campaign.
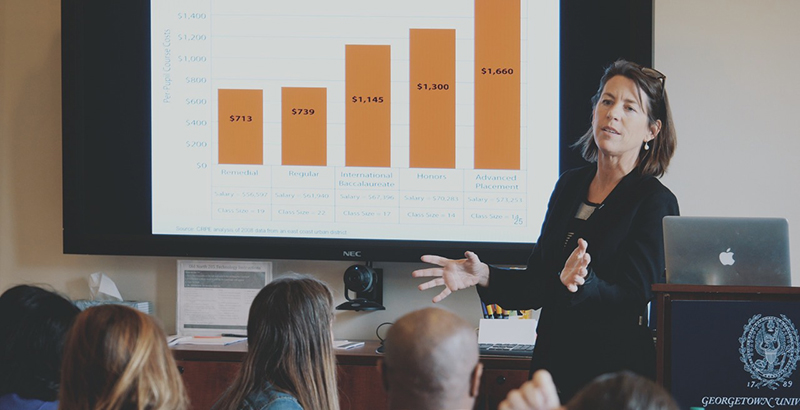
In fact, when Marguerite Roza, a Georgetown University professor and director of the Edunomics Lab, recently led a webinar for district leaders and offered to present their data back to them in an easier-to-analyze format, she said “the chat box lit up.”
Alaska Education Commissioner Michael Johnson and Sue Deigaard, president of the Houston Independent School District, are among those who have sought her guidance to better understand whether districts are spending money in ways that help their most vulnerable students.
“I see this as an opportunity for districts [that] want to understand where their dollars are spent and the impact of how those dollars are spent,” said Deigaard. For example, they could investigate whether an English learner from a low-income family is “getting the same investment” regardless of where they go to school.
Now, she can begin answering that question, and she’s been directing parents with similar issues about choosing schools to examine the data themselves. She highlighted Foster Elementary, where 90 percent of the students are Black and 99 percent come from low-income homes. Per-student spending at the school is $8,146. In 2019, 52 percent of the students met or exceeded grade-level performance in all subjects, up from 43 percent the previous year, and the school received an A accountability rating.
“They have just leaped,” Deigaard said.
But just about five minutes away, across a four-lane highway, is Thompson Elementary. Demographically the same as Foster, it receives $8,632 per student. Forty percent of the students met or exceeded grade-level expectations in 2019, the same as the year before. The school earned a C rating.
“Thompson hasn’t moved as fast,” Deigaard said, even though it’s getting more money per student. The upshot? “Where are you spending your dollars and what is the return-on-investment on those dollars?” she asked. “Digging in on that at a school-by-school level would help you identify best practices.”
For Deigaard, large spending gaps between schools raise the question of whether school funding decisions should be more centralized at the district level or made by local school leaders. She pointed to research from Rice University showing the Houston district’s move toward decentralization 20 years ago didn’t increase student performance.
Now, with the prospect of more relief aid, she wonders whether district leaders should have more say in how it’s managed.
“We don’t know what next year is going to bring,” she said. “We should be canning our surplus harvest if we get surplus money.”
Few states allow comparisons
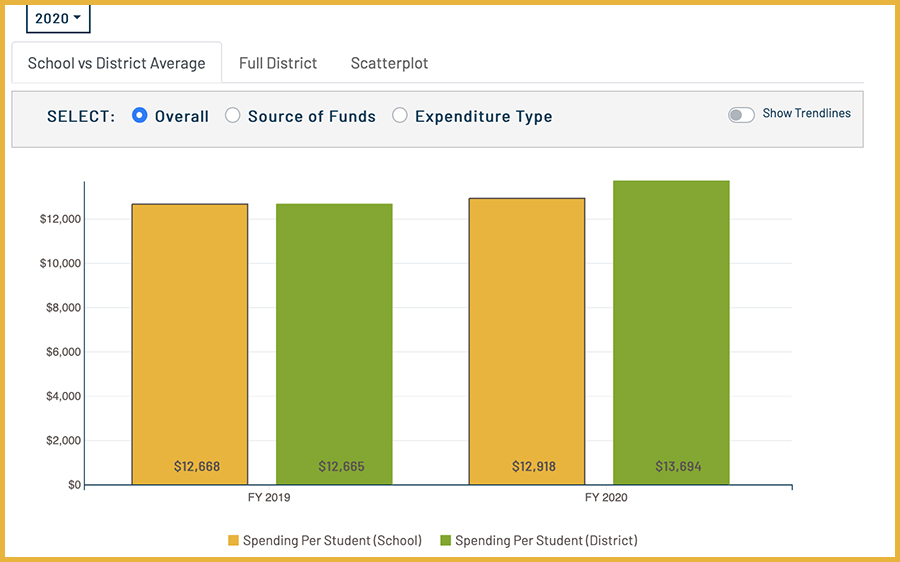
Some states, according to Roza and the Data Quality Campaign, are doing a better job than others of presenting the data and putting it in a larger context. The organization touted Illinois for its report card website, which allows for per-student spending comparisons between multiple schools.
“Seeing a single school does nothing,” Roza said.
Delaware is another state that gives parents, teachers and others multiple ways to compare how much schools spend on each student, the Data Quality Campaign’s report said.

But other states have errors or are missing data altogether. California publishes the information, but not on its official school “Dashboard” site, and parents might not know they need to search for another report to find it. New York has some small school districts that didn’t submit data, Roza said, and according to her School Spending Data Hub, Pennsylvania and South Dakota have not made any data available.
The pandemic interrupted Pennsylvania’s timeline for adding financial information to its state report card, according to Pennsylvania Department of Education spokesman Eric Levis.
Roza, however, noted that states had more than four years to comply.
It is unclear whether the states that are out of compliance will face any consequences from the U.S. Department of Education.
“The department did care about [states] getting the data up,” Roza said. “But it hasn’t done anything about those places that are completely behind.”
The department did not respond to questions on how it plans to handle non-compliant states.
Some state-level organizations have used the data to go a step further than their education agency websites. BEST NC, a business-led education nonprofit in North Carolina, created a tool that offers additional search options and helps users see patterns in the results.
“We wanted there to be some ability to look at schools that are like your school,” said Leah Sutton, the organization’s director of policy and advocacy. ” We wanted to really pinpoint schools that are doing a lot for kids and leveraging their money well for kids.”
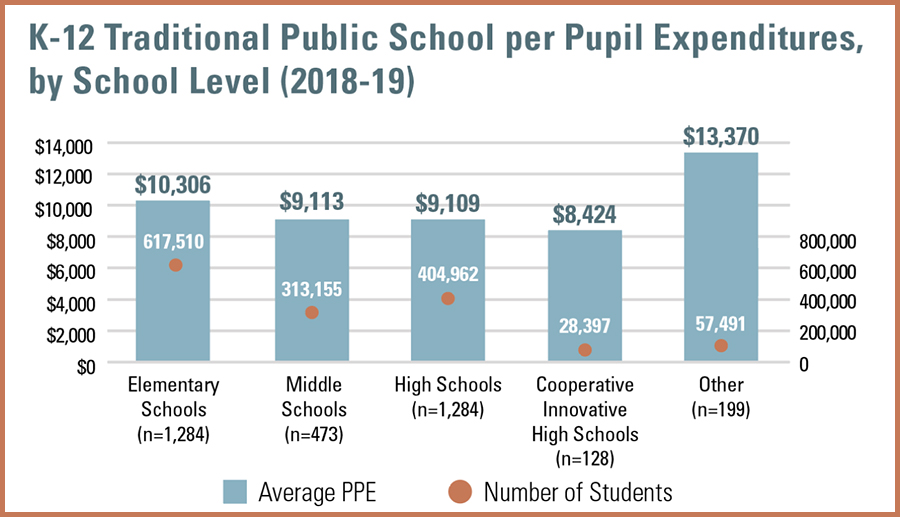
She highlighted that the state’s 132 Cooperative Innovative High Schools — which are based on college campuses and target students at risk of dropping out — are seeing positive results.
“Now we have the data to say in almost all of these cases, we’re spending less and getting great outcomes,” she said.
A study led by Julie Edmunds at the University of North Carolina at Greensboro showed students in these early-college models graduate high school with college credit or a two-year degree at higher rates than students who applied but didn’t get in.
“Even if early-college students do not go on to any further education, they are much more likely to enter the workforce with some postsecondary training,” the study found.

Forcing tough decisions
If states have to make budget cuts because of declines in revenue, knowing which types of programs are most effective for students is useful information at a time when the pandemic’s long-term impact on school funding remains unknown.
School year 2021-21 budget reductions won’t appear on report cards until 2023. But Roza and other school finance experts have said there are ways districts can use the school-level information now to prepare for cuts.
“States are facing massive budget shortfalls,” Cowen said. “That’s going to force tough decisions on what gets funded and what doesn’t. Having insight on where dollars are most effective is going to be hugely important.”
Policymakers and the public tend to focus on test score gaps between student groups and across schools and districts. But Roza said such conversations make more sense if they’re grounded in data about resources going to individual schools. She added if districts look at how they’re currently allocating funds, they can determine which schools they want to protect from reductions and which ones “can tolerate deeper cuts.”
In her recent analysis of what financial data has shown so far, Roza wrote that even though the law doesn’t require schools to show how they actually use the money, “having total spending by school for every school in the nation is a quantum leap forward.”
She’s working with a research center at the U.S. Department of Education to create a tool that will allow for comparisons across states.
In Tennessee, Pupo-Walker said the data would be useful if lawmakers attempt to revise the state’s current law for distributing money to schools. “I think for the most part parents understand that our funding is not adequate,” she said. The system requires districts to match state funding, but over time the state’s amount has remained flat, which makes it harder every year for districts to retain good teachers and provide quality programs. The per-student spending data, she said, can identify which districts are least able — because they have less property tax revenue — to provide the local match.
With many large districts losing enrollment this fall and growing concerns over students “falling off a cliff” and not connecting to remote classes, Roza added that how districts use resources to increase attendance could prove important in future years.
“How are you using it to go out and reach them?” she asked.
Get stories like these delivered straight to your inbox. Sign up for The 74 Newsletter

;)

