
;)
Untangle Your Mind!
Sign up for our free newsletter and start your day with in-depth reporting on the latest topics in education.
The bureau’s Public Education Finances: 2015 report, released Wednesday, details annual spending at national, state, and district levels. In addition to student spending, it also offers statistics on revenues, expenditures, and debt and assets for K-12 schools.
Per-student spending in 2015 was $11,392 nationally, a 3.5 percent increase from 2014 — this also marks the greatest increase in per-pupil spending since 2008, when spending increased 6.1 percent from the previous year. The figures include costs for instruction and support services as well as spending on employee salaries and benefits, student transportation, building maintenance, and other supplies and services.
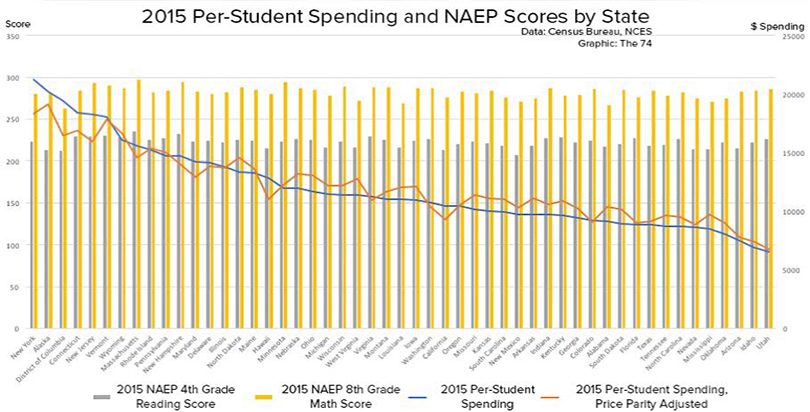
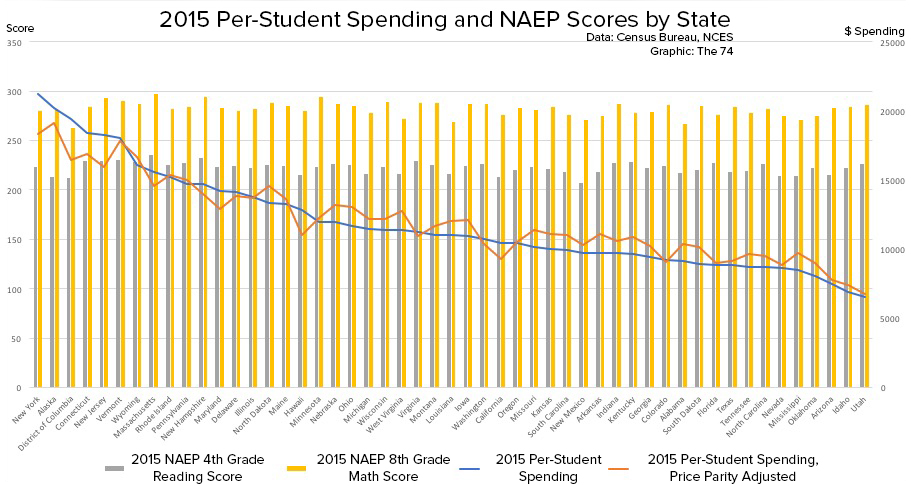
New York, the country’s largest school district, also led the nation in most dollars spent per student, at $21,206 — substantially more than the national average. Alaska and the District of Columbia spent the second and third most, at $20,172 and $19,396, respectively. Idaho and Utah spent the least per student, at $6,923 and $6,575, respectively.
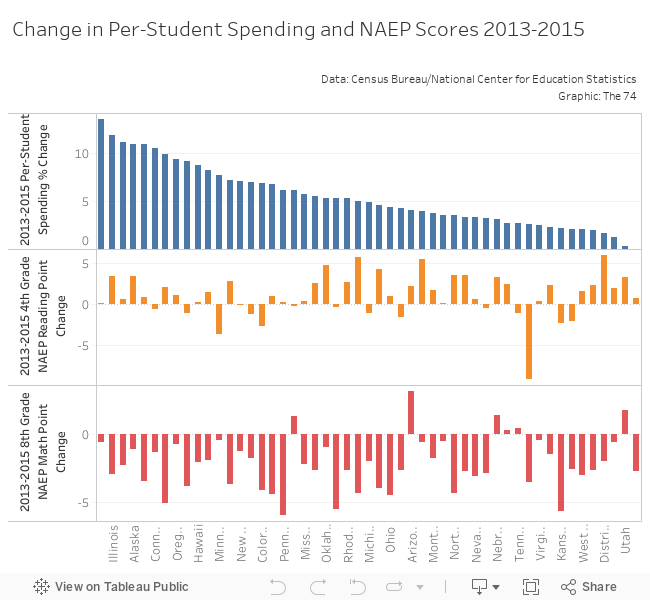
Every state but Arizona spent more per student in 2015 than the year prior. Alaska and California saw the greatest percentage increases, at 9.5 and 9.1 percent, respectively.
But even as spending on students ticks up in post-recession years, and even when that spending is adjusted for regional price parity, kids aren’t proving to be doing much better academically. Fourth- and eighth-graders across the country did worse in mathematics in the 2015 administration of the National Assessment of Educational Progress than they did in 2013, the last time the test was given. In reading, eighth-graders again performed worse in 2015 than in 2013, while fourth-graders’ scores remained stagnant.
Researchers have for years warned against attributing specific causes to NAEP’s results, particularly as new accountability measures and states’ adoption of the Common Core have driven greater scrutiny toward standardized testing. But the exam, also known as the Nation’s Report Card, is still considered a key gauge of how well American students are learning. NAEP exams are the only longitudinal study of students across socioeconomic demographics, geographic disparities, and ethnicities.
To be sure, the sobering 2015 NAEP results also come amid policy and demographic changes, as states adjusted to new educational standards as well as a larger body of English language learners and students from low-income families.
A number of critics and research argue that pouring more money into schools does not directly lead to better student outcomes. The findings for spending more on early childhood education and students living below the poverty line, however, offer compelling evidence that students do better when they have more resources. But experts tend to agree that spending matters, and how education funding is spent — and on whom — is how schools and districts can most effectively turn funding increases into academic gains.
Among the 15 states spending the most per student, eight were in the Northeast. Of the 20 states spending the least per student, 17 were in the South or West. In addition to New York City, the highest per-student district spenders were Boston; Anchorage, Alaska; Baltimore; and Howard County, also in Maryland.
Get stories like these delivered straight to your inbox. Sign up for The 74 Newsletter