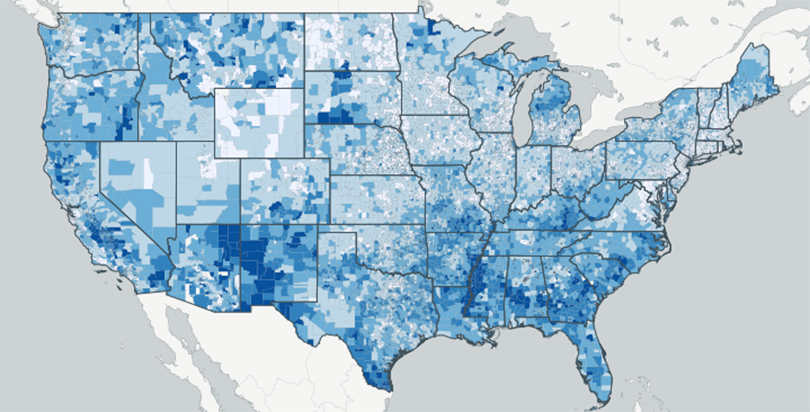
On July 7, EdBuild published a map that shows every school district in the country, its student population size, and its level of student poverty.
This was the first time this data had been presented in that sort of accessible and interactive way, and we are excited that the map has generated a lot of discussion about the nature of school district boundaries. We hope it will continue to serve as a resource to the academic and policy communities for further work and research.
While the map was chiefly intended to be an exploratory tool, we highlighted a few examples of school districts whose borders are particularly problematic, keeping the education benefits of higher property wealth within affluent communities and creating deep divides between children of different socioeconomic backgrounds. Boundaries like these deserve attention for two main reasons:
-
They mean that more school districts have high concentrations of student poverty—and that’s a serious problem.
-
Cordoning off local property wealth creates resource inequalities that harm the kids who are most vulnerable.
The Effects of Concentrated Poverty
Research shows that concentrated poverty, defined as 40% of individuals or more in a particular area falling below the federal poverty line, creates huge and unique challenges for students and communities. Students living in concentrated poverty are more likely to attend school in a building in decaying physical condition and to travel to school through dangerous and violent neighborhoods.
These students are more prone to drop out of school or become involved in negative out-of-school behaviors. They suffer from mental illness or stress-induced impaired mental function at higher rates than other children. And with so much neediness in a given neighborhood, the health and social service agencies that support the area become overburdened and often struggle to meet their communities’ needs.
The Results of Cordoning Off Property Wealth
Given the profound additional challenges faced by children and families living in concentrated poverty, it’s clear that schools in these areas need greater resources than schools in well-off neighborhoods do to serve their students well. But these school districts can’t raise the extra necessary funds through property taxes; given their low property values, the tax rate must be raised to such a high level that the burden becomes too great to bear.
In one powerful case, 40.4 percent of students in the Hartford, Connecticut school district live below the poverty line while in Greenwich, Connecticut, only 6.7 percent do. In an effort to support its schools, the Hartford community taxes its own property at a rate five times higher than Greenwich does.
This problem only exists, though, because poor communities are so often on their own when it comes to providing local revenue for schools. If district boundaries were drawn to include a more economically diverse set of neighborhoods, or if local contributions to education were more progressive at the state level, it would be possible to effectively support schools that serve students in concentrated poverty without beggaring their home communities through exorbitant property taxes.
When middle- and upper-class communities are permitted to seal their share of taxes within narrow borders, though, we create an illogical system in which low-income areas are taxing themselves at higher rates than affluent areas, far beyond their true means.
The State of the Problem
A number of state courts have ruled that it is the responsibility of their state governments to address the disparities in what these communities can raise. But many states aren’t doing the job, leaving in place a regressive school funding system in which higher-poverty districts receiving less funding than low-poverty districts.
The map shows the funding picture for districts that serve significant numbers of students in poverty (20% or more, matching the census definition for the number of poor residents that live in a “poverty area,” where earnings are lower, unemployment is higher, and educational attainment is less).
In only six states do these districts receive more state and local education funding than their more affluent counterparts, and in all but one of those, the greater funding is not very much more—8 percent or less, on average.
In 18 states, the funding levels for poor and non-poor districts are about the same (a difference of three percentage points or less); this parity, though, shortchanges higher-poverty schools, which need the resources to provide more supports and services to their students than do other schools. And in 23 states, we find the worst possible arrangement, with the neediest school districts funded at lower levels than wealthier ones.
(This map shows a broad snapshot of school funding inequity. For a more detailed and robust look at this issue, see the most recent edition of Is School Funding Fair, a report prepared by Dr. Bruce Baker of Rutgers University in partnership with the Education Law Center.)
Every parent wants the best for her child, and many poor communities have taxed themselves beyond any reasonable level in an effort to provide what their students need. But needy communities can’t, and shouldn’t have to, go it alone. Public schools are public for a reason; they educate and develop the children who become everyone’s workforce, everyone’s neighbors, and everyone’s fellow citizens.
It is in no one’s interest, and it is certainly not justice, to shortchange our neediest children in 41 states. It is incumbent upon communities with means to support the education of all students, not just their own. The future of American children is everyone’s concern.
Note on the map: State funding data cited above is derived from school district spending data reported to the National Center for Education Statistics. This predates a significant funding change in California, which may affect its classification in future years.
Get stories like these delivered straight to your inbox. Sign up for The 74 Newsletter


;)
