Harvard Economist Offers Gloomy Forecast on Reversing Pandemic Learning Loss
In 74 Interview, Thomas Kane says of his research: ‘Right now, there's no package of efforts that I'd be confident would be enough to close the gap’


;)
Untangle Your Mind!
Sign up for our free newsletter and start your day with in-depth reporting on the latest topics in education.
Get stories like this delivered straight to your inbox. Sign up for The 74 Newsletter
Two years of debate had raged over the scope and severity of COVID-related learning loss when, this spring, Harvard economist Tom Kane contributed some of the most compelling evidence of the pandemic’s effects on K-12 schools.
Along with collaborators from Dartmouth, the CALDER Center at the American Institutes for Research, and the nonprofit testing group NWEA, Kane released a paper this May incorporating pre- and post-pandemic testing data from over 2 million students in 49 states. Its conclusion: Remote instruction was a “primary driver of widening achievement gaps” over the last several years, with schools serving poor and non-white students suffering some of the greatest setbacks.
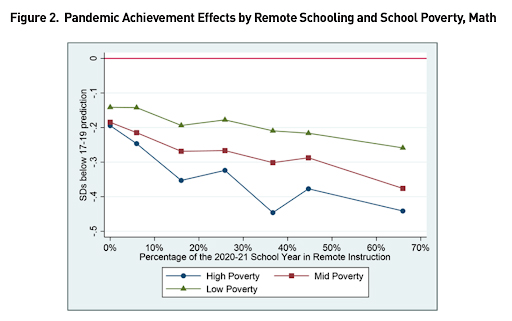
Overall, Kane and his co-authors found, high-poverty schools were more likely than others in the same district to stay remote throughout the 2020-21 school year; among all schools that stayed remote for longer, students at high-poverty schools showed much worse declines in math scores. And they calculated that some school districts would have to spend every dollar of their federal COVID relief money on academic recovery efforts to have any hope of making up the lost ground.
As Kane observed in a May essay for the Atlantic, local education authorities are required to use only 20 percent of those funds on pandemic-specific remediation. And there is sufficient reason to doubt that even the most promising educational interventions, such as personalized tutoring, can be delivered at the necessary scale to reverse the damage inflicted by COVID. Even the Biden administration’s recently announced campaign to recruit 250,000 new tutors and mentors is at least several months away from being fully realized.
Kane, the faculty director of Harvard’s Center for Education Policy Research, has spent decades carefully evaluating the effectiveness of school improvement efforts. A Council of Economic Advisors staffer during the Clinton presidency, he has studied school accountability systems, teacher recruitment policies, and the effects of affirmative action throughout long stints in both academia and think tanks like the Brookings Institution. His research on teacher evaluation inspired a half-billion-dollar initiative launched by the Bill & Melinda Gates Foundation to lift classroom performance in large school districts around the country.
Now he’s hoping to work with state and district leaders to combat an educational disaster whose effects, he says, are still not well understood. While policymakers may now have a loose idea of the challenges facing educators and families, the policies they’re currently reaching for will likely prove inadequate as a solution.
“Once that sinks in, I think people will realize that more aggressive action is necessary,” Kane said. “In the absence of that, it’s hard to blame local folks for not taking more aggressive action because they have no way to know that what they’re planning is nowhere near enough.”
This interview has been edited for length and clarity.
The 74: How do your findings and research design differ from earlier studies that have looked at pandemic-related learning loss? I’m thinking specifically of last year’s study conducted by, among others, Brown University’s Emily Oster, which also pointed to really steep losses associated with the switch to virtual learning.
Thomas Kane: There are at least two ways that this paper is different. The first is that we’re able to estimate magnitudes of losses in a way that’s comparable to the effect sizes of [educational] interventions. In that [Oster] study, they can focus on changes in proficiency rates on state tests. Each state has its own cut score, so the magnitude of the changes in proficiency rates depends on whether that cut score is near the middle or near the tail of the test score distribution. If my cut score is near the middle, even a small decline in achievement can mean a big swing in proficiency. But if my cut score is at the tail, even a large decline in test scores can show up as a small change in the percentage of people who are proficient.
‘Right now, there’s no package of efforts that I’d be confident would be enough to close the gap. Absent that, it’s no wonder that politicians aren’t willing to invest political capital in it.’
So while that study could qualitatively describe what was happening — in areas that were remote for longer periods, proficiency rates declined — they really couldn’t characterize the magnitude of the decline in any way that was comparable to the effects sizes, which I think is critical. As we’ve argued, it’s not at all surprising that there were larger losses in places that were remote for longer periods. It’s the magnitude of the losses that’s startling.
This design also lets you make comparisons within districts, as well as between districts, right?
That’s another big difference between our paper and what’s out there now. The [Oster] paper was focused on district proficiency rates, and what they found was that districts with larger shares of minority students and high-poverty schools had larger losses. But it could have been, for instance, that the implementation of remote learning was just weaker in those districts — districts with a higher share of students in poverty may have seen bigger declines in achievement, but the losses could have been similar in the high- and low-poverty schools in those districts.
By being able to look within districts, we were able to test whether the number of weeks of remote instruction had disproportionate impacts on high-poverty schools and minority students in those districts. Our answer was pretty clearly yes, there were bigger losses. And it wasn’t just because the urban districts had a harder time implementing remote instruction; even within those districts, the higher-poverty schools lost more.
You used the word “startling” to describe the learning loss. Were you expecting to see effects of this size?
We went in without any clear expectations on the magnitude of the impacts we would see. The reason why I called it startling was because I know that there are very few educational interventions that have ever been shown to generate a .45 standard deviation impact [a common measure showing the difference in any population from the statistical mean; they can be loosely converted into other units, such as learning time or dollars spent] on achievement. Yet that’s the size of the loss that high-poverty schools that were remote for more than half the year sustained. So it was startling because when we compare the impact estimates of remote learning to the potential impact of the available interventions, it’s clear that there is no one thing that we could say, “If all districts did this and implemented it with fidelity, it would eliminate the gap in one year.”
For instance: In a review of the pre-pandemic research, tutoring has been found to generate a gain of about .38 standard deviations. Well, you could provide a tutor to every single student in a high-poverty school that was remote for half the year and still not close the gap. You could get close, but you wouldn’t close that gap. And we know that districts are never going to be able to hire enough tutors to provide one to every student in a high-poverty school, let alone deliver that tutoring at the level of quality as these programs evaluated in the research. That’s why it was startling — not just because it conflicted with our prior expectations, but because when we saw it, we realized that we couldn’t come up with a long list of interventions that yield effects of this size.
So what can schools and districts realistically be expected to do in this situation?
We can’t be thinking of this as a one-year catch-up. If we really are committed to making students whole and eliminating these losses, it’s going to be multiple years. There are other interventions that have been shown to have effects, it’s just that no single intervention gets you all the way.
One example is double-dose math. There’s a study in Chicago, and another based in Miami-Dade, that found that an extra period of math instruction over a whole year generates about .2 standard deviations.
“You could provide a tutor to every single student in a high-poverty school that was remote for half the year and still not close the gap. You could get close, but you wouldn’t close that gap. And we know that districts are never going to be able to hire enough tutors to provide one to every student in a high-poverty school, let alone deliver that tutoring at the level of quality as these programs evaluated in the research.”
So more districts should probably be thinking about something like that, especially in high-poverty schools. But like tutoring, increased math instruction requires staff; you can’t double the number of math classes students take without increasing the number of math teachers. Again, districts should be considering doing some of that, but it will also have constraints on the scale they can implement.
Another possibility, which a lot of districts are already planning for, is summer school. There are studies suggesting positive impacts of summer school. But [the effects are] small. The big challenge with summer school is getting kids to attend regularly, because it’s viewed as optional learning time. That’s not a reason not to scale up summer school, it’s just that we shouldn’t think that doubling or even tripling the percentage of kids going to summer school is going to close these gaps. It’s not. You get a learning gain of about .1 standard deviations — around five weeks of learning — based on the pre-pandemic research.
One option that really hasn’t gotten much serious consideration, largely because of political pushback from parents and teachers, is extending the school year. If we extended the school year by five weeks over the next two years, that would obviously cover 10 weeks of instruction. I recognize that teachers would have to be paid more for that time. In fact, they ought to be paid something like time-and-a-half. But that’s the kind of option that I hope will gain attention once people realize the inadequacy of the steps that they’re currently considering, like small increases in summer school or tutoring a small percentage of students. It’ll become apparent that that’s just not enough, though my fear is that it may not become apparent in time. Based on what I’m seeing, most districts are going to find that students are still lagging far behind when they take their state tests in May 2023. The danger is that if they only discover that then, and only start planning more ambitious recovery plans then, much of the federal money will have been spent already. That’s why we’re trying to get the message out about the scale of the declines, and the likely scope of the efforts required to close them, while there’s still time to act.
Districts only need to spend 20 percent of their COVID relief funds mitigating learning loss. But you and your co-authors created a formula to determine the financial cost of reversing this academic harm, and in many cases, that figure would basically demand every dollar allocated by Washington.
We try to put the scale of the [learning] losses and the amount of aid that districts have received in the same scale. We report both as a share of an annual school district budget, which I think is a useful starting point for thinking about what it’s going to cost a district to recover. If a district has lost the equivalent of, say, 22 weeks of instruction as a result of being remote, and you’re asking what it’s going to cost to make up for that, the lower bound of the estimated cost would have to start with [the question], “What does it cost to provide 22 weeks of instruction in a typical school year?”
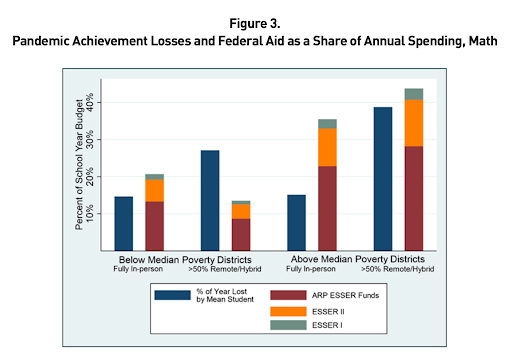
The answer would be whatever share of a district’s typical annual budget is spent over 22 weeks. In the paper, we use a 40-week year, under the assumption that salaries are paid over 40 calendar weeks instead of just 36 instructional weeks. And then we put the amount of federal aid that districts got on that same scale — say, what share of a typical year’s budget districts receive. We think that’s a useful starting point for people, and what they’d see is that in the high-poverty districts that were remote for more than half of 2021, the amount of aid they received is basically equivalent to — maybe a little more, but not much more than — the magnitude of their losses in terms of instructional weeks. That just means that, rather than spending the 20 percent minimum that was required in the American Rescue Plan, some districts should be thinking that they’ll need all of that aid for academic catch-up.
I have to say, this conversation is leaving me pretty pessimistic that some of this lost ground can ever be fully recovered. Without asking you to look into a crystal ball, is that concerning you as well?
Yes, but here’s a more hopeful spin: A friend of mine sent me a political ad for one of the gubernatorial candidates in Rhode Island, Helena Foulkes. She says, “I’m running for governor, and my top priority is restoring students’ achievement, and if I fail to restore achievement, I’m not going to run for reelection. Hold me accountable for whether we catch kids up.”
I would hope more politicians take that pledge, and that the way to judge mayors and school board members and governors over the next couple of years is on whether they succeed in restoring students to their pre-pandemic levels of achievement. It would be that kind of accountability that would wake people up to the need for more aggressive action now. It’s one thing to read these reports about achievement losses nationally, but it’s another thing to see that your own schools, locally, followed exactly the pattern of this report.
Most districts have seen the statistics from [the Oster paper] and know that their proficiency rates have declined by 10 or 15 percentage points. But that kind of statistic, as we’ve discussed, doesn’t really convey the severity. We’d like to provide districts with the tools to gauge the losses in the kinds of units — like standard deviations, or dollars spent, or weeks of instruction — that they could compare to the effect sizes of educational policies. That could make it easier for people to translate their local losses into a package of interventions of equivalent size. In this Atlantic piece I wrote, I tried to put both the learning loss and the intervention effects into instructional weeks rather than standard deviation units to make it easier.
I think that needs to happen. Local decision makers need to see the scale of their students’ losses in ways that are more readily comparable to the expected effect sizes of the interventions they have to choose from. Once that sinks in, I think people will realize that more aggressive action is necessary. In the absence of that, it’s hard to blame local folks for not taking more aggressive action because they have no way to know that what they’re planning is nowhere near enough. It certainly sounds impressive to say, “We’re going to double our summer school enrollment and provide a tutor to 5 percent of the students in our schools.” All of that would reflect more than the catch-up effort in a typical school year, but it’s only when you compare those to the effect sizes for those interventions, and the magnitude of their losses, that you realize that it’s nowhere near enough. So we’ve got to make that lack of proportionality clearer to local decision makers, and not just in these national reports.
Another recent study using MAP data found that U.S. students had sustained as much academic damage from school closures as kids in Louisiana suffered after Hurricane Katrina. But after the storm, the whole New Orleans school district was fundamentally restructured, such that it’s now mostly composed of charters. What do you think of more drastic attempts to change the organization of schools and districts?
Here’s one reason why this challenge is greater — and it’s actually related to the situation in Boston. I think that if people were confident that a state takeover would produce the big improvements that are necessary in Boston, there would be political will. The problem is the uncertainty: “If we take this very difficult step, is it going to produce the results we’re hoping for?”
If some district said, “We’re a high-poverty district, and we were remote for more than half of 2021. What should we do?” I could list a few things they should be trying, but I couldn’t point to a package that would definitely close the gap because it’s an unprecedented gap. There is one thing I think could provide the hope and ammunition that would generate political will: We could organize for the next few months around a set of interventions to be launched in the spring of 2023 and then find a few places that would be willing to try that package of things. If we could evaluate those and generate some results early in the summer of 2023, we could then say, “Here is a set of interventions that, if you implement them, it’ll get you a long way toward closing the gap.” And I think we’d have an easier time persuading people to use the political capital you need to invest in that.
So to anyone reading this interview: If there are districts or states that are willing to implement some really creative catch-up strategies next spring and want to contribute to an evidence base that the rest of the country can use, I want to work with you! Right now, there’s no package of efforts that I’d be confident would be enough to close the gap. Absent that, it’s no wonder that politicians aren’t willing to invest political capital in it. But if we had that, we could all get behind advocating for them. It would help everybody if a small set of districts would step forward and try to provide a model for the rest of the country to copy.
“The way to judge mayors and school board members and governors over the next couple of years is on whether they succeed in restoring students to their pre-pandemic levels of achievement. It would be that kind of accountability that would wake people up to the need for more aggressive action now.”
The clock is ticking, and I think we’d have to do it next spring. I’m sure we could design a study and get results out quickly to people about the type of effort that would generate enough [learning] gains. But there shouldn’t be just one model we’re trying — there should be multiple approaches that we systematically try next spring, and ideally, one or two of them will prove to deliver the effects we need. And then we could organize advocacy around those.
So what comes next for your research in this area?
We’ve been working with a group of 14 districts that are giving us data on which kids they provided tutors to, which kids got double-dose math, and various other things over this past school year. We’ve been working with the NWEA data and hope to have a report out in August laying out the effect sizes that districts got for the interventions they attempted in 2021-22.
Get stories like these delivered straight to your inbox. Sign up for The 74 Newsletter