Exclusive: Free New AI Tool to Help Americans Search and Compare Student Test Scores Across All 50 States
Brown University’s Emily Oster says Zelma could democratize school performance data as schools struggle to recover from pandemic.

;)
Untangle Your Mind!
Sign up for our free newsletter and start your day with in-depth reporting on the latest topics in education.
Get stories like this delivered straight to your inbox. Sign up for The 74 Newsletter
A free, AI-enabled tool promises parents, researchers and policymakers a no-fuss way to access state assessment data, offering up-to-date academic information for all 50 states and the District of Columbia.
The online tool, its creators say, will democratize school performance data at an important time, as schools nationwide struggle to recover from the COVID-19 pandemic.
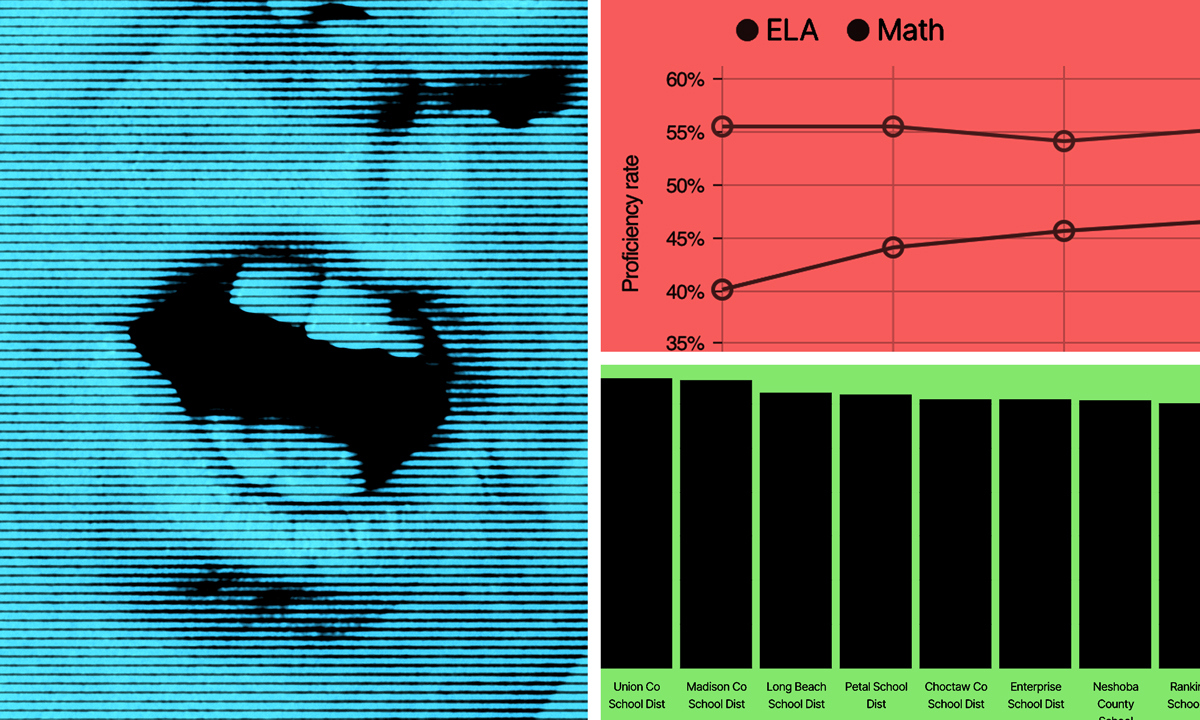
Scheduled to go live today, the new website sports a simple interface that allows users to query it conversationally, as they would a search engine or AI chatbot, to plumb math and English language arts data in grades 3-8. At the moment, there are no firm plans to add high school-level data.
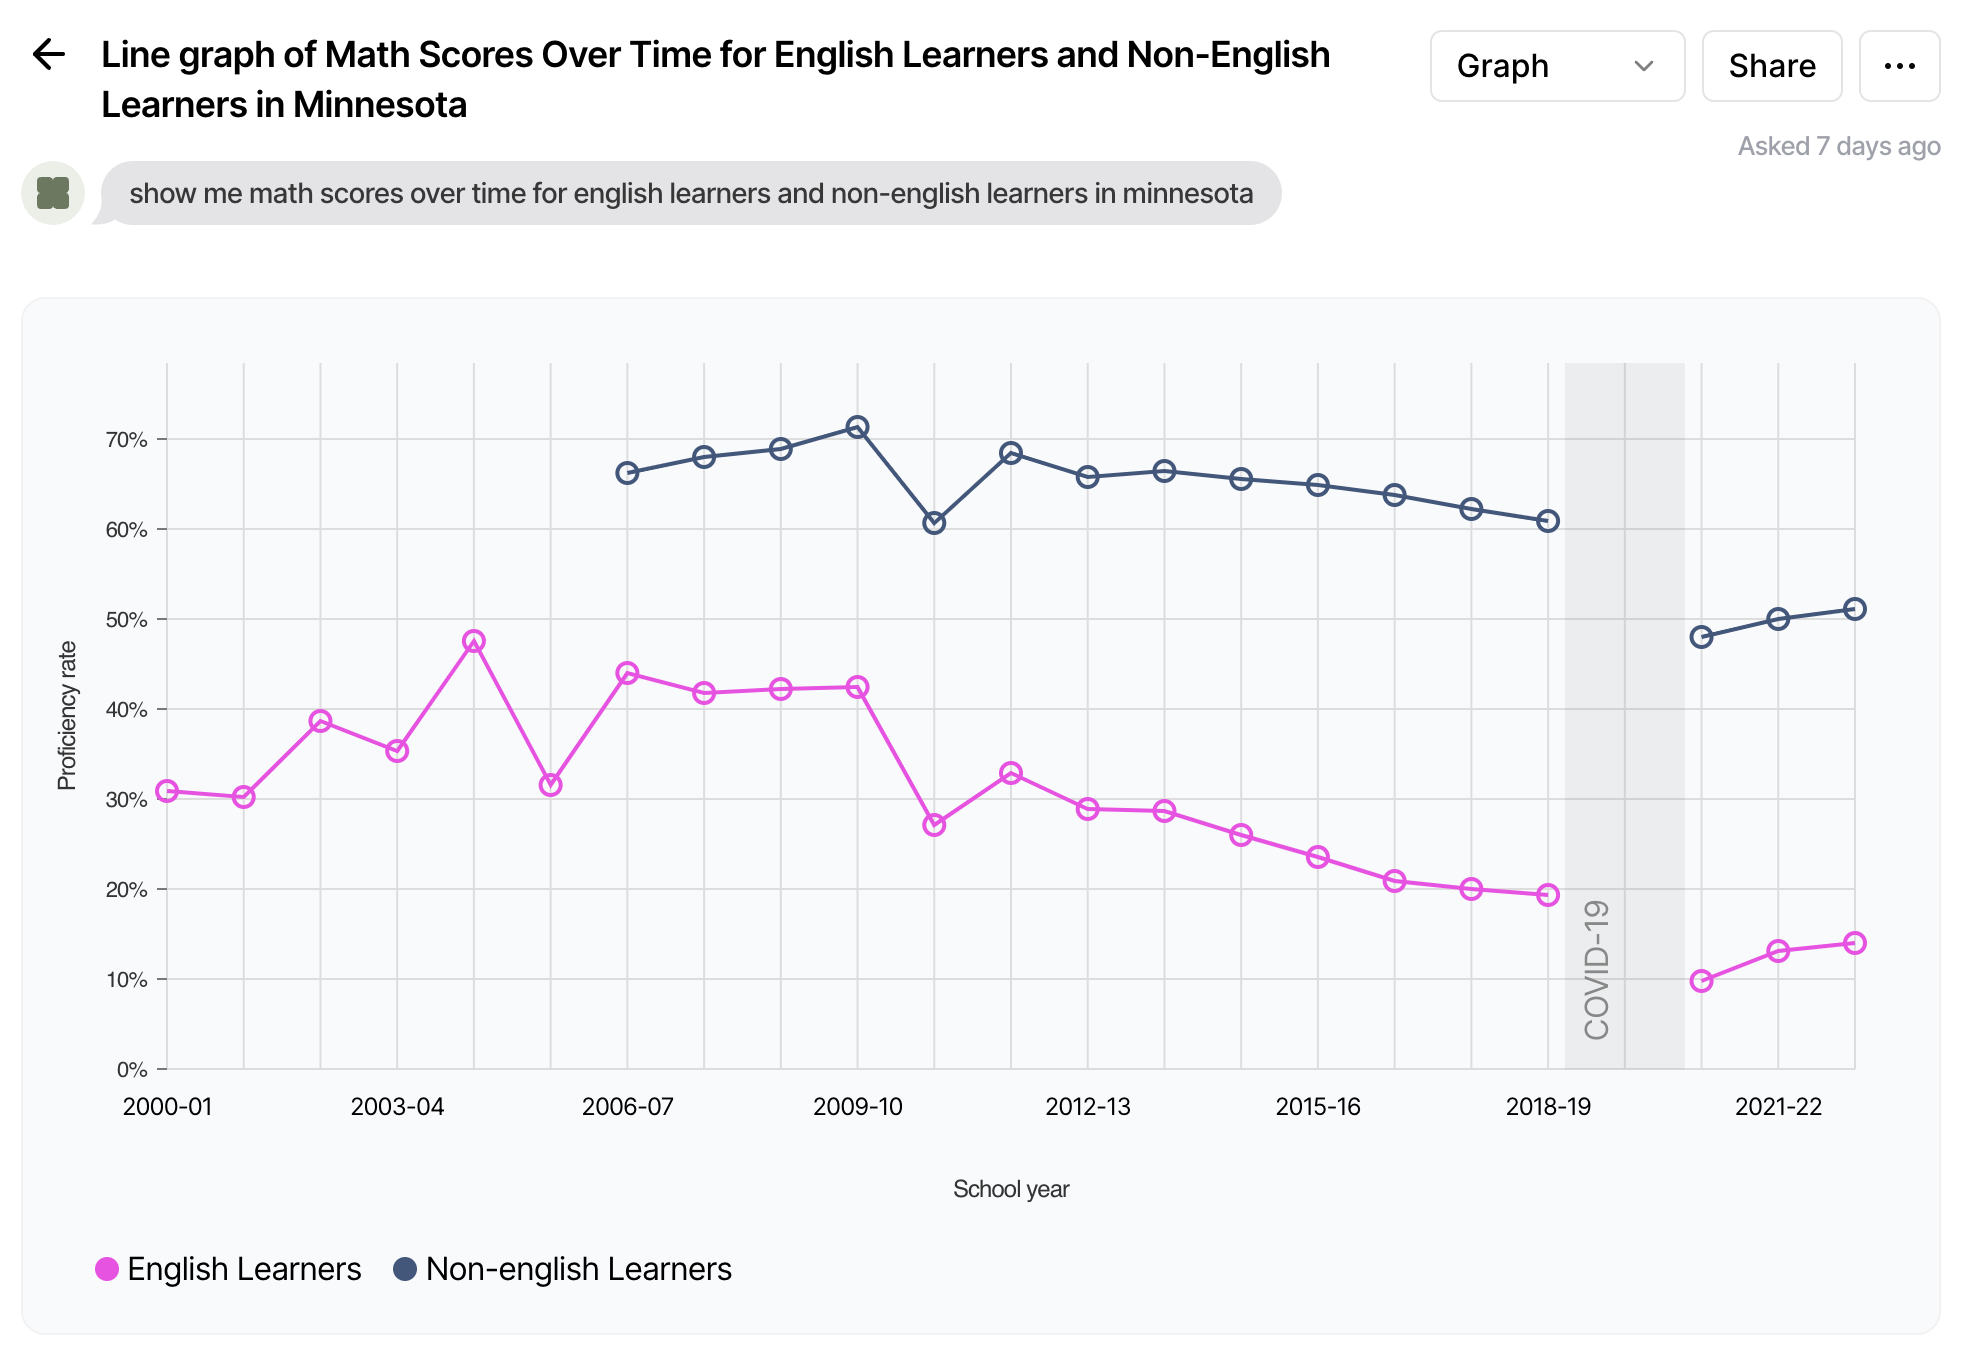
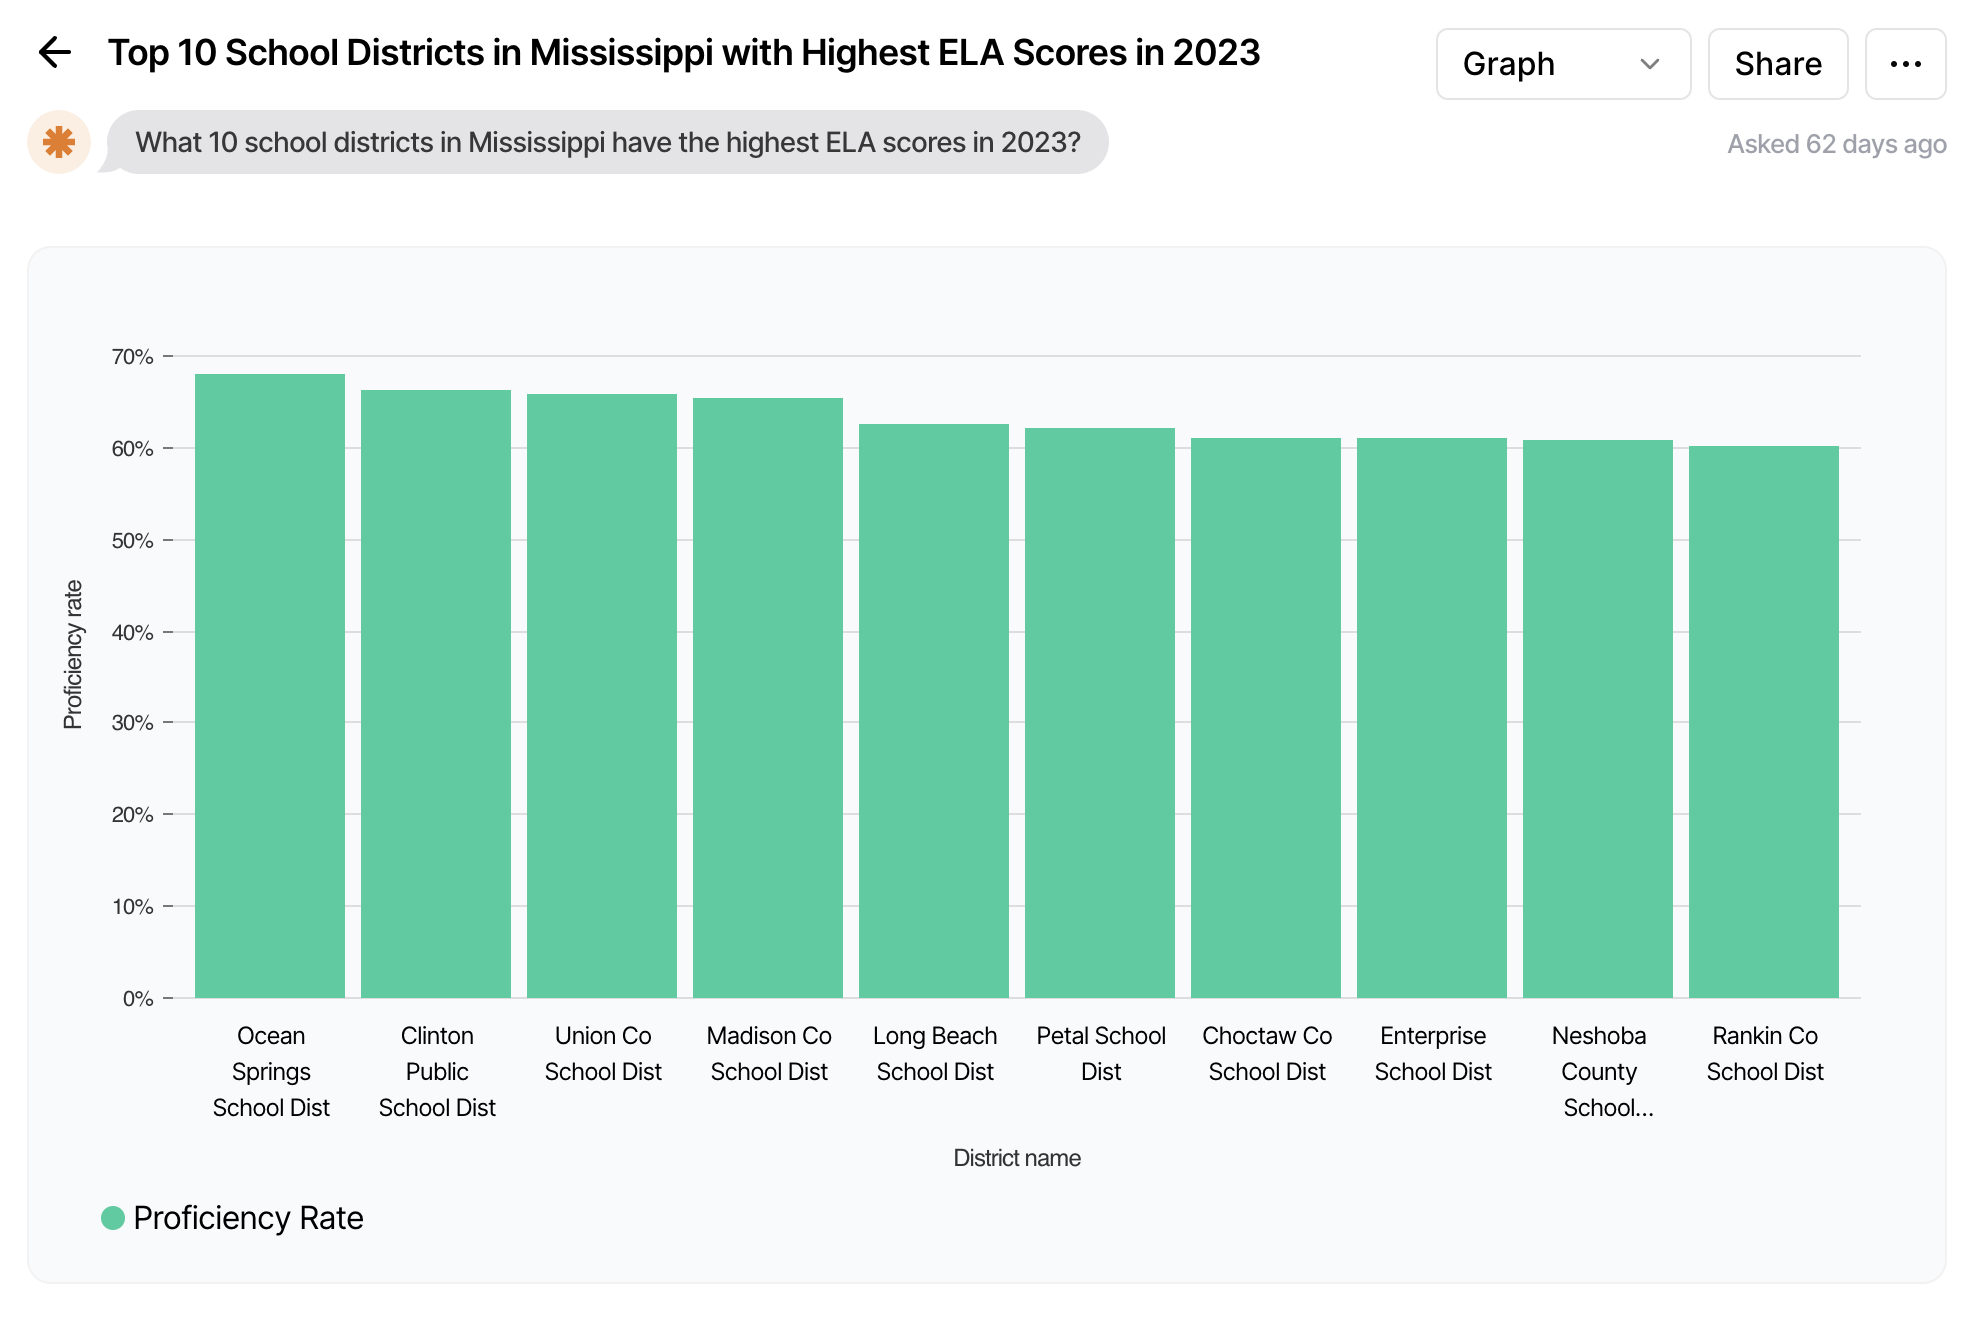
If, for instance, a superintendent is curious about math scores for kids learning English in her state, she can just ask: “Show me math scores over time for English learners and non-English learners in Minnesota.” Want to know the 10 school districts in Mississippi with the highest ELA scores in 2023? Ask it.
Similarly, parents moving to a new town or neighborhood can ask about data for individual schools in most cases.
The project, dubbed Zelma, is a partnership between Brown University and Novy, the company that built the site’s AI functionality.
The tool takes a cue from data dashboards, such as the federal government’s EdFacts initiative, which collect statewide assessment information. This one goes further, allowing more up-to-date analyses of state, district and even school-level data, with protections that shield individual students’ scores in small districts and schools.
Within state, local and school-level data, users can also break down results by race, ethnicity, economic level and other indicators.
The AI aspect allows users to query the database in plain language, said Emily Oster, a well-known economist who often writes on parenting. Oster led the tool’s development and said its potential customer base is broad, from parents and school board members to state policymakers and journalists.

“You can imagine people actually wanting to see in a more granular way, or be able to explore in a more granular way: ‘How are different schools in this district doing’ or ‘How is my district doing relative to another district?’ This will make that much easier.”
Oster said the tool is so easy to use that a school board member sitting in a board meeting could pull out her phone and in a few seconds produce a chart showing school-by-school test results districtwide.
Policymakers could also benefit from the tool, she said, since they can’t always access state assessment data without cumbersome requests to state education officials. “And that takes time. If you want to have access to get an insight quickly, this is going to make it easier.”
What’s perhaps most useful, Oster said, is the ability to look inside individual states, down to the district or school level, to figure out which schools and populations are doing better than others. “I think that’s actually pretty powerful in terms of where the policy is made.”
Reliance on ‘plain language’
Project Manager Clare Halloran said Zelma grew out of Brown researchers’ own frustration in trying to compare COVID recovery data across states. “It was usually hard to find out where the information was, what was missing,” she said.

Even states with public-facing data portals and dashboards don’t make the job easy, she said, as many are “a little bit clunky.” They rely on dropdown menus that can only offer one indicator at a time. With Zelma, she said, “You can really just kind of say in plain language what you’re looking for,” even if it involves several variables.
“I think it will make a lot of data just a lot more accessible to a lot more people,” she said. “When the states release their data, we get the headline. But it’s hard for the average person to explore it a little bit more.”
All queries are public but the authors aren’t identified. The site resembles a Twitter-like feed, with the most recent queries at the top so users can see what others want to learn about.
It also offers warnings — dubbed “notable events” — that caution users not to read too much into proficiency levels in certain cases, such as in states and districts where new assessments are being administered, or where they see lower participation rates.
And while it can offer rudimentary comparisons between states, Oster said neither Zelma nor the assessments themselves are built for such comparisons.
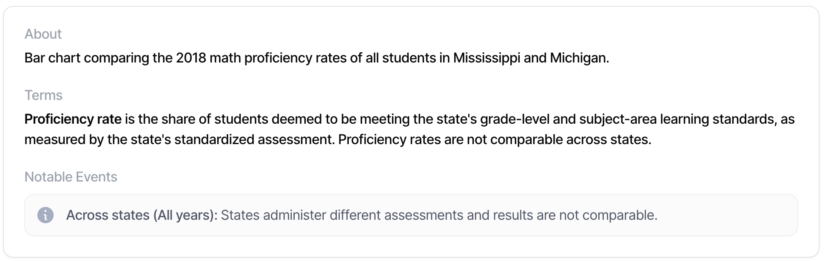
“There are things across states you might get out of this, for example how much recovery has there been” in one state vs. another, she said. “You can sort of squint a little and think about differences in trends. And I actually think there is some stuff we can learn from those kinds of trends. But in terms of levels, these data are just not well suited to a question of, ‘Is Mississippi outperforming Michigan?’ That’s why we’ve got the NAEP data.”
Actually, asking the tool to compare states will prompt a warning saying that states administer different assessments and that proficiency rates “are not comparable across states.”
Even with a more user-friendly interface, though, the site is only as good as the data underlying it — and it’s uneven among states. Minnesota, for instance, offers test scores clear back to the late 1990s. But Rhode Island has no data before 2018.
And, of course, virtually no states returned test scores in 2020 and 2021, when the U.S. Department of Education granted blanket standardized testing waivers amid the pandemic.
Paul Peterson, who directs the Program on Education Policy and Governance at Harvard University’s Kennedy School, said he welcomed the ability to more easily dig into states’ updated testing data.
“Any enhancement of transparency is a good thing,” he said.
Disclosure: Walton Family Foundation provides financial support to Zelma and The 74.
Get stories like these delivered straight to your inbox. Sign up for The 74 Newsletter