Child Care Solutions Need to Target Most Vulnerable Communities, Report Argues
North Carolina advocates are particularly worried about programs’ ability to remain open and accessible as federal funds end.

;)
Untangle Your Mind!
Sign up for our free newsletter and start your day with in-depth reporting on the latest topics in education.
Get stories like this delivered straight to your inbox. Sign up for The 74 Newsletter
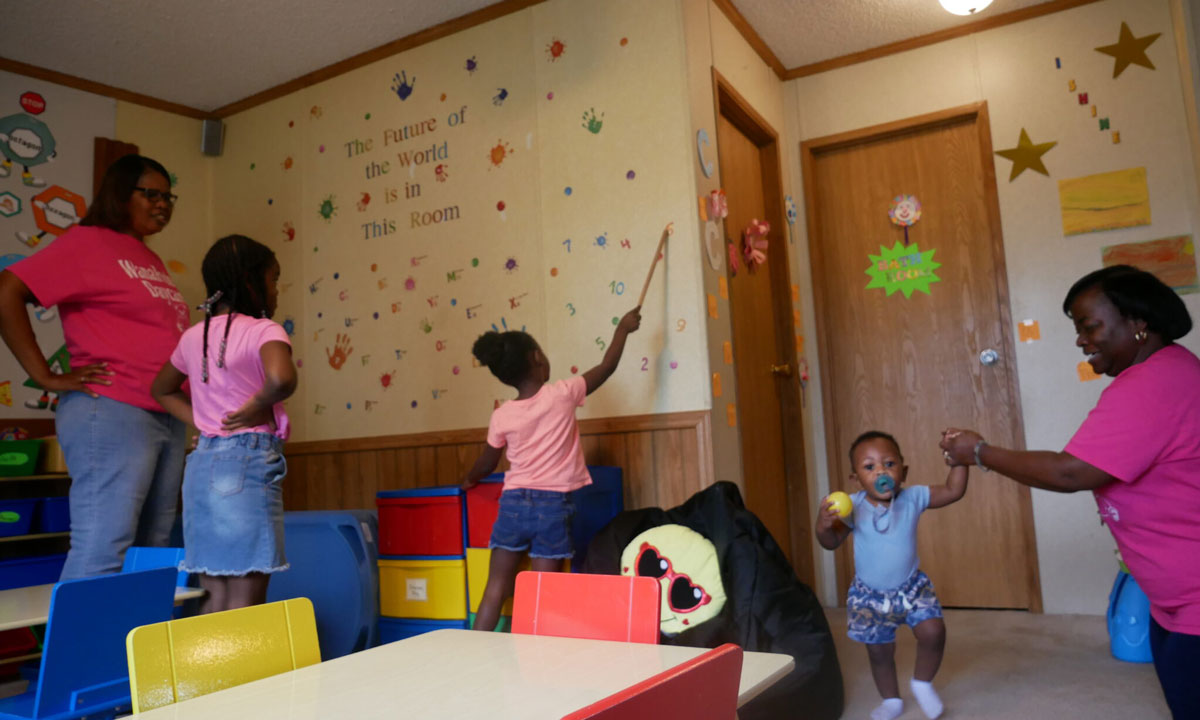
Child care is expensive and hard to come by for everyone. Local and statewide business leaders, advocates, philanthropists, and policymakers are asking how to solve that problem across the state.
But young children and families in certain communities and parts of the state are particularly lacking in early childhood access and opportunity, says a new report from the Frank Porter Graham Child Development Institute (FPG).
“We really have to prioritize those who we have already systematically been put in a position of economic precarity,” said Iheoma Iruka, FPG fellow and founding director of the Equity Research Action Coalition at the institute.
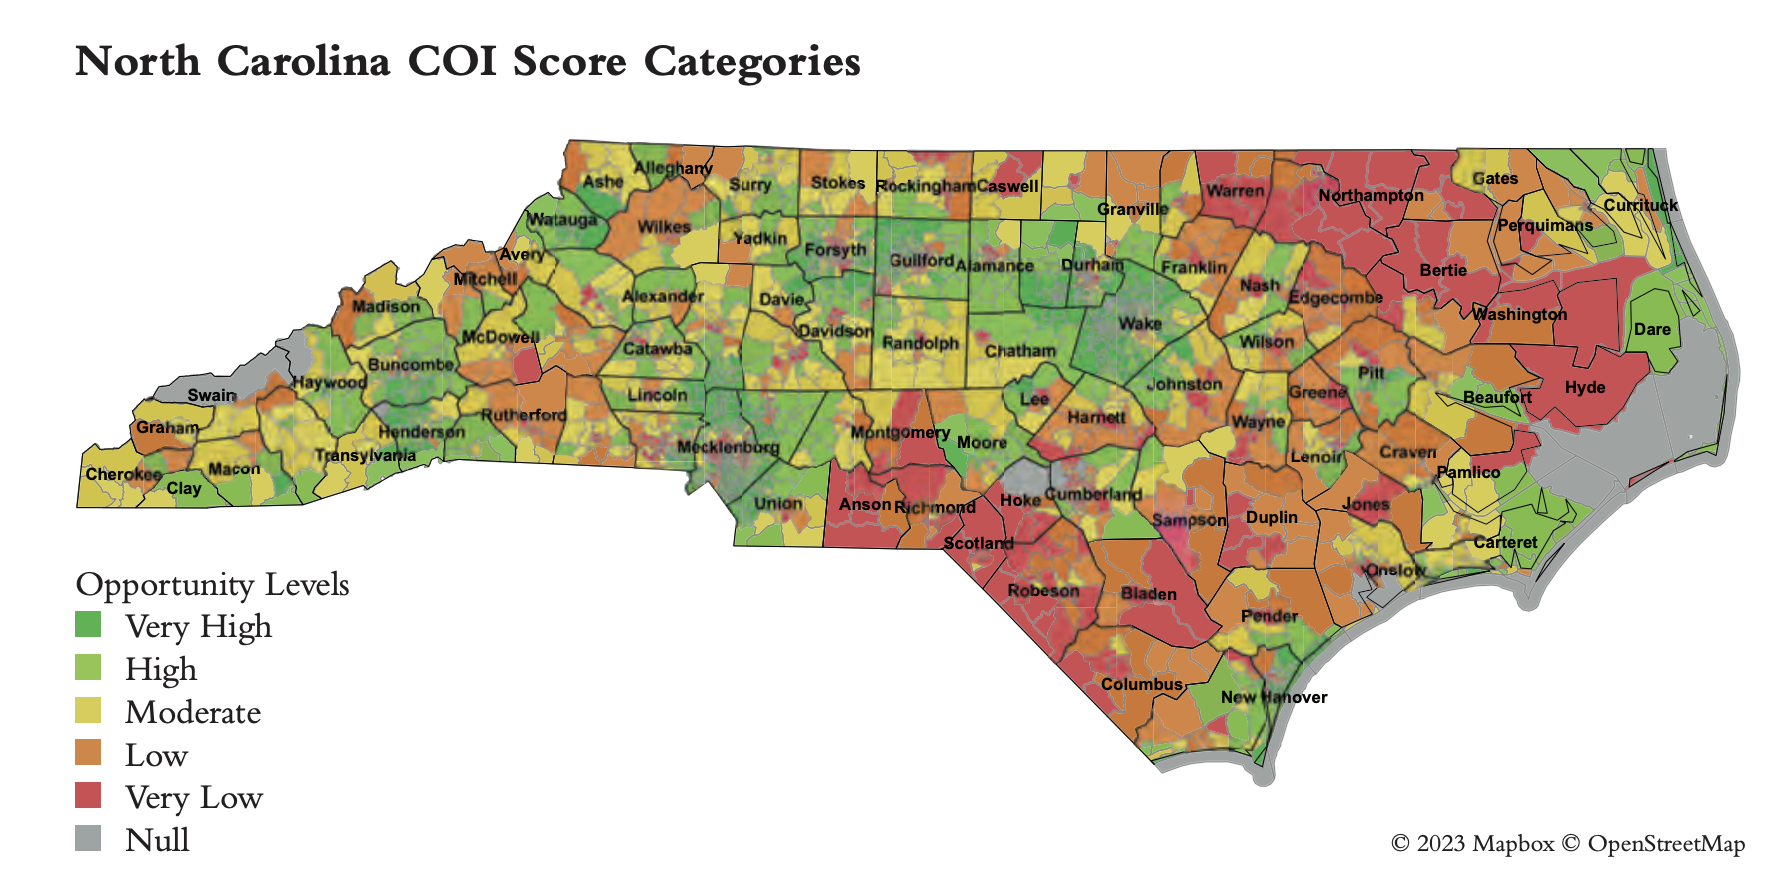
“There is a consistent pattern in which certain communities — particularly those that have low Child Opportunity Index (COI) scores, especially in the northeast part of the state — are less likely to have high-quality programs,” says the report, “Start with Equity: NC Early Childhood Education Equity Analyses Project.”
The COI measures neighborhood factors that matter for healthy child development, such as quality schools, clean air, access to health care, and safe housing.
As the state’s early childhood programs teeter on the funding cliff projected for the end of June, Iruka said specific attention is needed in places where young children and families have lower COI scores.
“The cliff itself is going to impact them the most because they have less wealth, they have less resources, and they are the most vulnerable to any catastrophe,” she said. “The people who lose out are the people who are always on the brink of economic destitution.”
In states that have already run out of federal funds, or gone over that cliff, child care has become more expensive and less available. North Carolina advocates are particularly worried about programs’ ability to remain open and accessible as those funds end, due to an inability to pay competitive wages to teachers.
Which communities are most vulnerable?
COI scores are the highest in central and urban areas, including the Triangle, Triad, and Mecklenburg County, the report found. The lowest scores are in the far east (Hyde and Bertie counties), southeast (Robeson, Scotland, and Columbus counties), and far west (Graham and Cherokee counties).
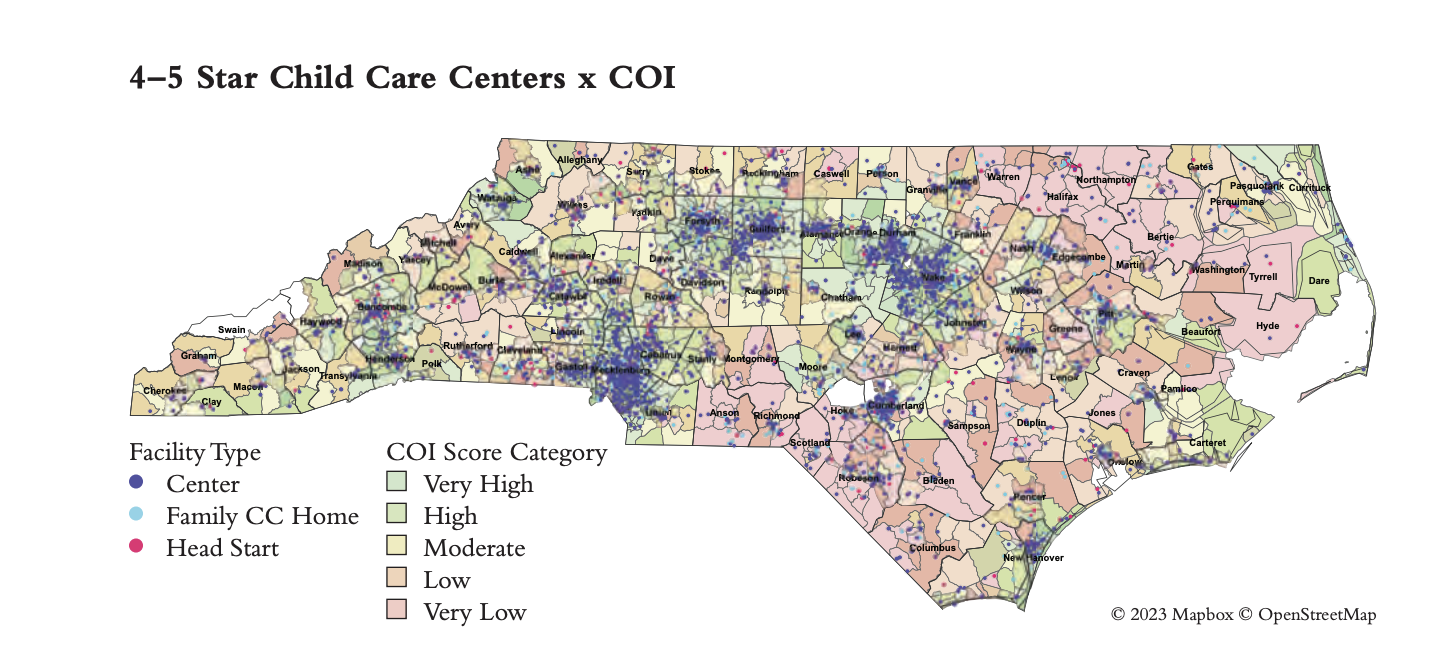
The report found that the areas with higher COI scores had clusters of high-quality licensed child care centers. There were particularly few high-quality options in the northeast part of the state.
At the census tract level, the report found high-quality centers (rated four or five stars on the state’s licensing system) were serving neighborhoods of high, moderate, and low opportunity at about the same rate.
“However, this does not mean that there is a sufficient number of quality programs in low-opportunity areas, given that more children in these neighborhoods have a greater need for quality programming than in high-opportunity areas,” the report says.
The report also looked at the reach of public funding streams designed to target low-income families with young children.
NC Pre-K and Title 1 funding for pre-K, generally used for 4-year-olds, was reaching more children in areas with low COI scores. That makes sense, given that both funding streams are meant to target students from low-income families.
The same was true with child care subsidy slots. “While children four years old and younger who live in low-income households and in low COI communities are likely to receive subsidy, there was generally an even distribution of subsidy regardless of COI ratings at the county level,” the report says.
The report measured the distribution of subsidy slots, not the distribution of subsidy funding, which varies across the state depending on county-level market rates.
The report found that the higher the percentage of Black children in a county, the lower the COI score. It found the opposite was true about white children: the higher the percentage of white children, the higher the COI score. There was no correlation between the percentage of Latine children and COI scores.
When it comes to access, the report found there was not a statewide over- or under-representation by race/ethnicity in NC Pre-K or child care subsidy.
But in certain counties, that’s not the case.
For NC Pre-K, Black children were under-represented in 46 of the 100 counties, while white children were over-represented in 21 counties and Hispanic children were over-represented in 17 counties.
For subsidy, Black children were under-represented in 32 counties, while white children were over-represented in 32 counties. Data on Hispanic children receiving subsidy funding were unavailable.
What to do
Early care and education solutions need to address the variation in communities’ needs, the report argues. Iruka said she hopes policymakers, administrators, and advocates can use the report’s findings to push for more useful data and more equitable investments and policies.
“We have a lot of work to do to fully make sure that our youngest babies are able to get what the families believe that they need and they deserve,” Iruka said.
Specifically, the report calls for leaders to:
- Prioritize and target specific populations and communities furthest from opportunity, including: racially an ethnically minoritized populations, infants and toddlers up to age 2, communities of concentrated poverty, unhoused children and children experiencing homelessness, dual-language learners, and children with disabilities.
- Move beyond compliance to focus on quality improvement efforts by restructuring how quality is measured and by ensuring the equitable allocation of technical assistance (TA), coaching, training, and other quality improvement support by allocating greater resources to those with the greatest need. Maintain a laser focus on an accountability and continuous quality improvement system that is aligned with the goal of closing disparities in outcomes.
- Focus on family child care (FCC) homes as part of a robust mixed-delivery system by increasing initiatives to support FCC providers, such as creating FCC networks or incorporating Pre-K into FCC.
- Address poverty-level wages for the early childhood workforce.
- Ensure that subsidy rates are sufficient for child care providers to provide quality programming.
- Address data governance and lack of data for equity analyses by possibly using the Head Start model to obtain more comprehensive data to 1) identify communities and households farthest from opportunity by conducting racial equity analyses that require attention to child, family, and community sociodemographics, such as race, ethnicity, income, language, adversity, and their intersectional identities and 2) utilize geographical markers to better target resources.
- Ensure attention is focused on addressing equity in access and resources for all. One possibility is to leverage the Head Start model to ensure that all children and families have access to resources, especially those in communities with multiple and layered inequities. Providing children living in poverty with the same access to resources—but with limited attention to environmental and intergenerational stressors and trauma—will not ultimately advance equity.
This article first appeared on EducationNC and is republished here under a Creative Commons license.
Get stories like these delivered straight to your inbox. Sign up for The 74 Newsletter