Analysis: With New ESSA Data, States Can Track How Well Schools Are Serving All Students. New Report Shows How They’re Doing — and Why

;)
Untangle Your Mind!
Sign up for our free newsletter and start your day with in-depth reporting on the latest topics in education.
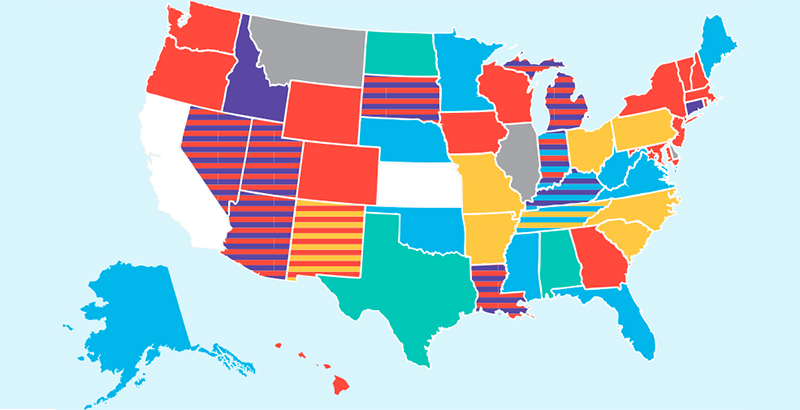
Growth has been a hot topic among education policy wonks for years, and last year 48 states and the District of Columbia opted to include growth data in their accountability systems under the Every Student Succeeds Act. It’s exciting that a broad commitment to measuring individual student growth is happening across the country, yet states are using a variety of different methods to calculate it — and not all growth measures are created equal.
What is growth data? It looks beyond measures of performance at a moment in time, like a single test score, and instead use a student’s assessment data over time to evaluate that child’s academic progress. Every child should be making progress in school year after year, and growth data provides critical insight into whether that’s actually happening.
Now, this is where it starts to get complicated. The way states design their growth measure has huge implications for what that measure can tell us — and demonstrates to the public which information a state values. Most states are using at least one of five common measures of student growth, though each state has customized its own approach and many are implementing multiple measures together.
Value-table, gain-score, and growth-to-standard measures use different methods to track students’ mastery of state learning goals over time. Student growth percentile measures, on the other hand, rank how students are performing compared with their academic peers in other schools. And value-added measures demonstrate the impact of schools on student achievement. Value-added measures also use more advanced calculations and multiple data points and have the ability to account for other student characteristics such as family income.
The best of these can provide critical information about how well schools are educating kids from all racial/ethnic and economic backgrounds.
More and more educators and policymakers across the country are turning their focus to equity, looking at how school systems are working for underserved populations, like students of color, low-income students, and rural students. Now that states are showing that they see the value in growth data, it’s time to marry this conversation with the one about their equity goals, because the two ideas are inherently linked. While each growth measure has merits, only some can speak to that question, like value-added models that use advanced statistics and multiple data points to evaluate the impact of schools on student achievement.
Most growth measures are highly correlated to family income level, but the value-added measure is an example of a growth measure that can account for student demographics. It’s true that for a few years, talk about value-added measures got swept up in conversations about teacher evaluation, but the model has been around for decades and was developed to offer insight into how much students are learning, regardless of their proficiency level. Place side by side with proficiency measures, value-added offers a more complete picture.
What do we expect our schools to do? How do we know if they are successful? The answers to those questions speak to our values. And the data we use to answer them — both what is collected and how — makes a powerful value statement. If we value an education system that is working for every child in this country, we need to know exactly how it is working for every child in this country. We need to have a conversation about how we hold ourselves accountable for moving the needle on student progress.
The Data Quality Campaign’s new resource, Growth Data: It Matters, and It’s Complicated, can help states start that conversation. It outlines the various methods of calculating growth that states are using and introduces some of the questions each can answer. These are huge questions that have consequences for accountability, including how resources are allocated and the public perception of school performance.
Is my state measuring the impact of schools, taking into account the diversity of students they teach? Are my community schools doing a good job developing students from different backgrounds? Whether you’re a state legislator, a teacher, or a parent, these are the types of questions you should be asking. And if your state is using a growth model that can’t answer these questions, the next question should be: Why not?
Jennifer Bell-Ellwanger is president and CEO of the Data Quality Campaign.
Get stories like these delivered straight to your inbox. Sign up for The 74 Newsletter
Jennifer Bell-Ellwanger is president and CEO of the Data Quality Campaign.
contributors@the74million.org