Analysis: A Different Type of Bracketology — How Teams That Would Have Made the 2020 NCAA Tournament Score in Equity

;)
Untangle Your Mind!
Sign up for our free newsletter and start your day with in-depth reporting on the latest topics in education.
Every year around this time, the NCAA releases its list of 68 teams that will participate in the March Madness tournament. This year, the tournament was canceled due to the COVID-19 outbreak. Unfortunately, this year, fans around the country must forgo the ritual of analyzing team statistics, weighing defensive and offensive strengths or choosing their favorites based on mascots and team colors to build their brackets. In keeping with our own tradition, we at HCM Strategists are once again taking a different approach to the bracketology.
Though March Madness will not go on this year, we are running data on the teams that had been expected to play in both the men’s and women’s tournaments and building our own brackets based not on athletic performance but on how equitably these colleges and universities are serving low-income students and students of color. Instead of free-throw percentages, rebounds and turnovers, what if we judged a team’s strength by the school’s graduation rates for underrepresented students and how many Pell Grant recipients they enroll?
To answer these questions, we gathered data to build a story about how each institution performs in areas of equity that we believe are most salient. Just as the statistics for the number of turnovers indicate a strong defense, the statistics we sought out can indicate that an institution is doing a good job of supporting certain populations of students. Specifically, our brackets focus on four main metrics: the access gap, the percentage of low-income students served, the graduation gap and the graduation rate for underrepresented students.
Access Gap: The difference (in percentage points) between student groups that are underrepresented (black, Latino, Native American) and those that aren’t (white, Asian).
- Why this matters: Colleges that give equal opportunity to all types of students are equitably supporting typically underserved populations that have lower higher education attainment.
Percentage of Low-Income Students Served: The proportion of a college’s students who are Pell Grant recipients.
- Why this matters: Affordability is the largest obstacle to a postsecondary education. If a school is admitting Pell Grant recipients, it is serving a portion of the population that faces the most systemic barriers to enrollment.
Graduation Gap: The difference (in percentage points) in graduation rates between groups of underrepresented students and those who aren’t.
- Why this matters: Students from historically underserved communities graduate at lower rates and encounter more complex barriers to college completion than just affordability or academic preparedness. This is a measure of a university’s ability to holistically support a student’s unique needs.
Graduation Rate for Underrepresented Students: The overall graduation rate for underrepresented students.
- Why this matters: This is an indication of a college’s ability to meet all students’ needs inside and outside the classroom.
While these are effective measurements of how a school serves underrepresented students and works to advance equity, they are not exhaustive. Advancing equity at the institutional level is complicated, and student success is about more than enrollment and graduation rates. However, given the availability of data that are openly accessible, these are the best tools we can use to measure institutional progress.
A college could earn from one to four points for each metric. Four points were earned if the outcome was in the highest-performing 25 percent of scores, three points if the outcomes fell in the 50 percent to 75 percent range, and so on. We added up the scores for each metric and then ranked the schools.
This ranking determined the results of head-to-head matchups. The proportion of enrolled students who are Pell Grant recipients — the second metric — was used as a tiebreaker. The data are based on the most recent information available from the Integrated Postsecondary Education Data System.
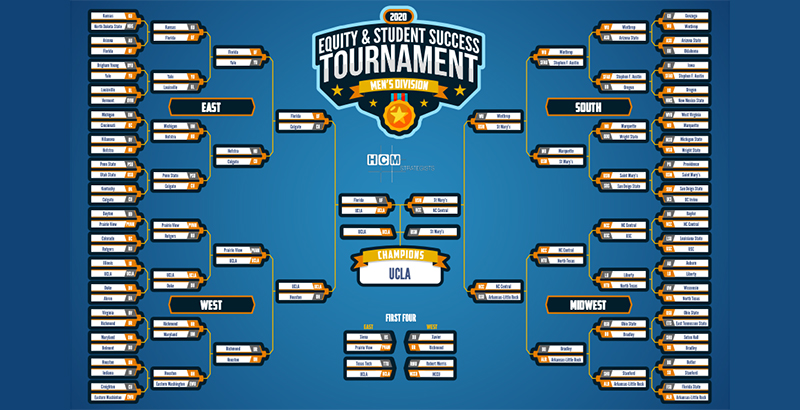
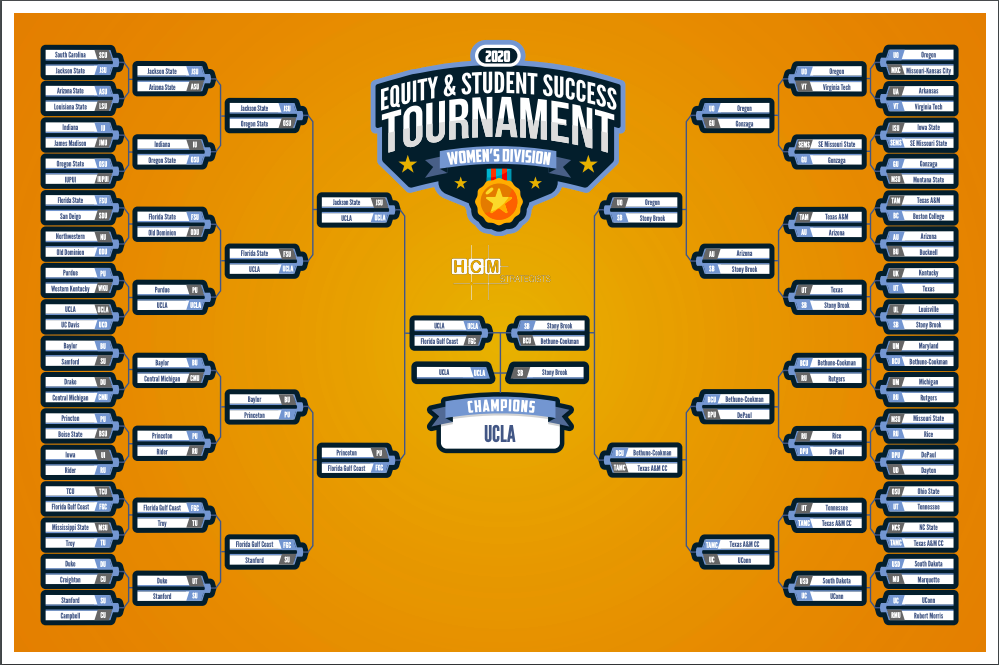
Who came out on top in this year’s tournaments? For the first time, UCLA’s men’s and women’s teams both won their respective brackets. The men’s Final Four consisted of the University of Florida, UCLA, North Carolina Central University and Saint Mary’s College of California, with UCLA edging out Saint Mary’s as the ultimate winner. The Final Four contenders for the women’s bracket were UCLA, Florida Gulf Coast University, Stony Brook University and Bethune-Cookman University, with UCLA dominating Stony Brook University for the national championship.
Clutch performers (Access Gap and Graduation Gap)
Men’s teams: New Mexico State University, North Carolina Central University and Prairie View A&M University all had negative access gaps, while Prairie View, Providence College and Saint Mary’s had negative graduation gaps. A negative access or graduation gap signifies that a university is enrolling or graduating underrepresented students at higher rates than those students who are not underrepresented.
Women’s teams: Bethune-Cookman, Jackson State University and Texas A&M Corpus Christi had negative access gaps, while Jackson State was the only university in the women’s tournament that had a negative graduation gap.
Blue-chip talent (Low-Income Students Served)
Men’s teams: Prairie View A&M led the way, with 66 percent of its student population receiving Pell Grants.
Women’s teams: Bethune-Cookman surpassed every school in both brackets, with 76 percent of its students receiving Pell Grants.
Traditional powerhouse (Underrepresented Student Graduation Rate)
Men’s teams: Duke and Yale universities were tied for first in their underrepresented student graduation rates of 95 percent.
Women’s teams: Duke outperformed all other universities in this category, with an underrepresented student population of 95 percent.
The 2020 March Madness tournament winner — UCLA for both brackets — will claim the Equity and Student Success title because of its excellence in enrolling, serving and graduating students of color and low-income students.
While the cancellation of the tournament will undoubtedly have implications for the players, teams and fans, the COVID-19 pandemic also has implications for students at all institutions throughout the country. Universities are closing their campuses, shutting down dorms, extending spring breaks, moving classes online. These measures have important equity consequences for students, particularly those who are homeless or who experience food insecurity. For many students, the dorm is the only housing they have, and the campus meal plan provides the only consistent access to food. In addition, 22 percent of undergraduates are also parents; they may well be struggling with canceled classes and online courses for their children as well as for themselves.
There are countless ways that this pandemic will exacerbate existing inequities in students’ daily lives, and it is important for university leadership to consider the lasting consequences that their decisions during this time will have on their most vulnerable populations.
Although teams were not given the opportunity to play in the official basketball tournament, we commend each institution in our Equity and Student Success brackets for their efforts in creating a more equitable higher education environment for the students they serve.
Danielle Zaragoza is an associate with HCM Strategists’ postsecondary policy team, where she focuses on dual credit and transfer policy issues between high school and college. Elizabeth Salinas is a senior research associate on HCM’s postsecondary team. Jessica Collis is an HCM senior associate.
Get stories like these delivered straight to your inbox. Sign up for The 74 Newsletter