March Madness Is Canceled and the Courts Are Silent. But These Basketball Powerhouses Are Still Real Champions in Students’ Lives

;)
Untangle Your Mind!
Sign up for our free newsletter and start your day with clear-headed reporting on the latest topics in education.
Since 1939, sports enthusiasts have relished the March Madness that is the NCAA’s men’s Division I basketball tournament. But in the wake of the coronavirus pandemic, it was called off, along with the NBA season and nearly all sports events. Its cancellation, just days before the participants were to be announced, left hundreds of schools, thousands of students and millions of fans who longed to be part of it devastated.
The decision to call off the tournament was not made lightly. There were those who wanted it to continue even if spectators were not present. Others wanted to shorten it to a week, while still others merely wanted the teams that would have been invited to at least be named. But although the tournament represents nearly 80 percent of its annual revenue, the NCAA set aside those suggestions. With that decision, the schools that might have won big will not be able to enjoy the expected spoils from a rise in applications, donations and alumni support. And the hundreds of players, for whom the tournament would have been the culmination of years of sweat and effort, have been understandably left with a profound sense of disappointment.
These uncertain and frightening times will eventually pass, and when they do, we will need to refocus on what matters most for the millions of students now tethered to their electronic devices as they struggle online to complete their courses. To help make that possible, we will take this time, when the courts are silent and our thoughts are sober, to discuss what makes a school a real champion in a student’s life.
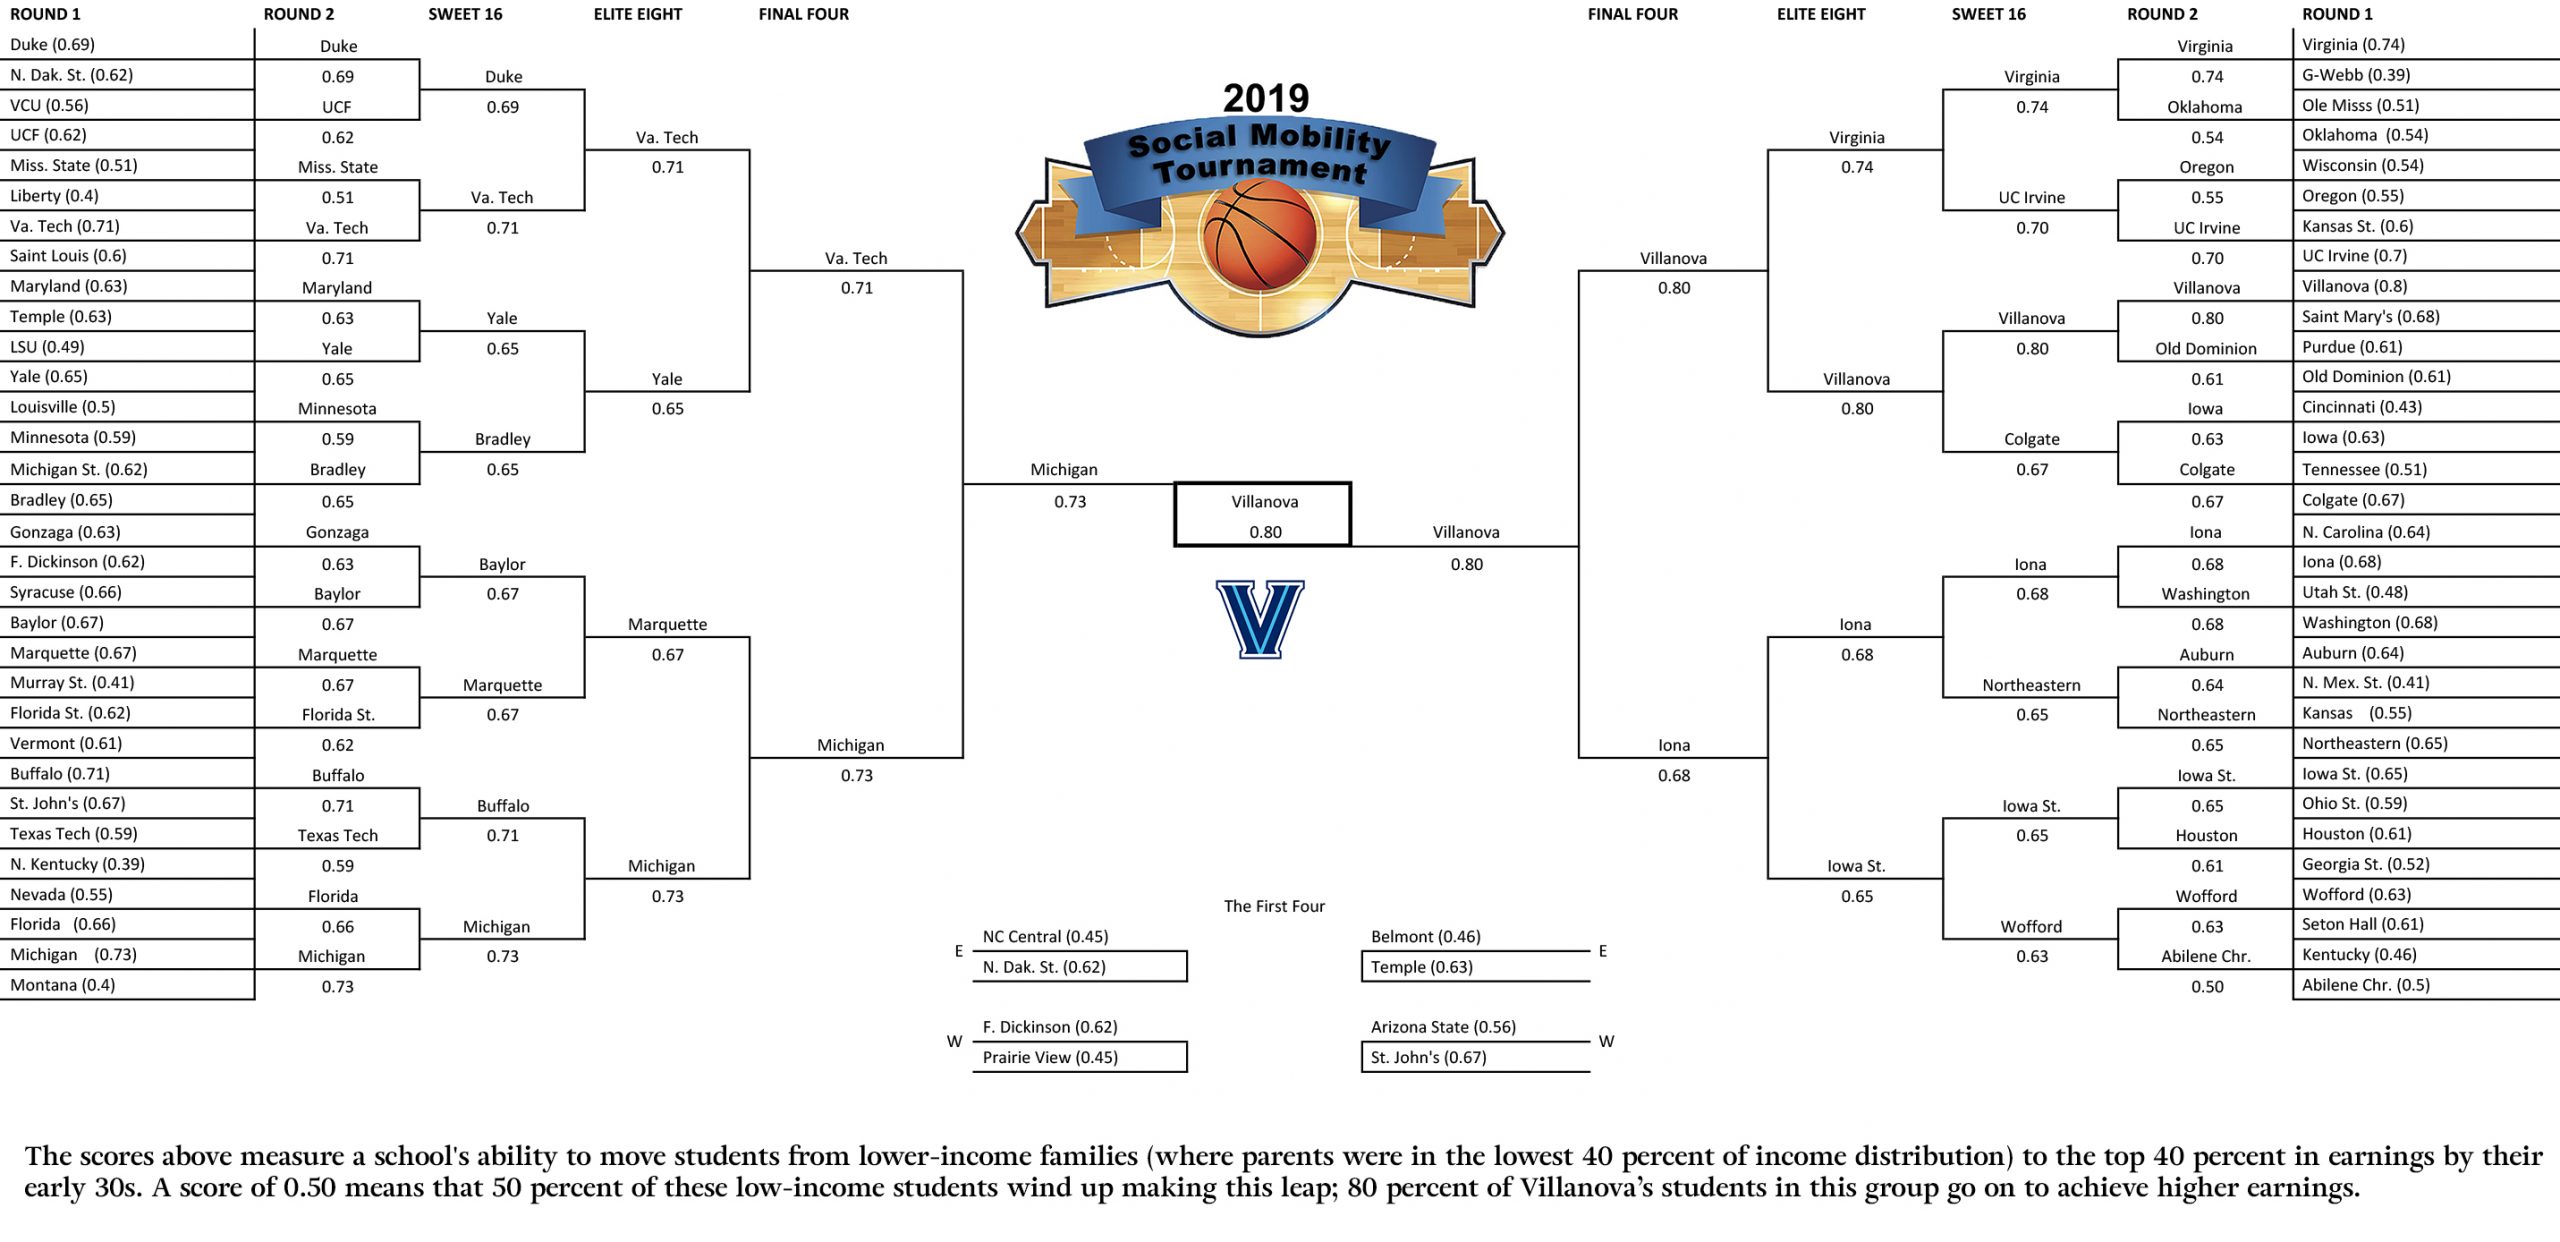
To help this conversation along, for the past three years, we have created a parallel bracket that takes the NCAA tournament colleges and plots them on a Social Mobility Tournament bracket based on how well each school helps its students reach the American Dream of upward mobility. This bracket, as seen in the 2019 version below, has served as an alternative ranking of tournament participants by highlighting how well their students have done in the workplace as opposed to how well their players have done on the court.
A big part of the American Dream rests on the idea that children will do better than their parents. As comforting as that sounds, this goal has been fading over the past 50 years. Whereas children born in 1940 had a 90 percent chance of outearning their parents, only half of the children born in the 1980s could expect the same. Neither better technology nor better health care nor even greater access to college has helped to stem this downward slide. The culprit, researchers agree, is growing income inequality. Therefore, one possible way to help reverse some of this decline rests on schools focusing on getting their students to the finish line — because nothing contributes more to upward mobility than the completion of one’s studies.
However, most Americans who view higher education as the gateway to financial well-being worry that colleges — many with abysmal graduation rates — are not helping their students rise on the ladder of income distribution.
With this in mind, since 2017 we have created a distinct mobility bracket that can permit colleges doing a good job at improving their students’ chances of success to advertise themselves as winners at what most matters to them. At the same time, our annual bracket can help students and parents focus on how well or how poorly schools that are successful in sports (like basketball) also succeed at putting their students on the road to financial security.
Our calculations of mobility scores rest on a data set created by the Harvard-based Equality of Opportunity Project, known today as Opportunity Insights. This data set combines millions of anonymous income tax returns with information on thousands of American colleges. In the first two versions of our parallel bracket (for the 2017 and 2018 NCAA tournaments), we mapped each school using a mobility rate that represented the percentage of its students who attended college in the early 2000s, as 19- to 22-year-olds, coming from households in the bottom 20 percent of the income distribution, who by 2014 had managed to reach the top 20 percent of earners.
However, given the increased attention from the public and policymakers to students’ postcollege earnings (and to their student loan debt), using the same data set, last year we began calculating student mobility as an adjusted mobility rate. Rather than focusing on the few poor students who reached the highest-earning category, this rate calculated the percentage of low-income students at each college — those born to parents in the bottom 40 percent — who reach earnings in the upper 40 percent of household income by their early 30s.
As we stated when we made the switch, we believe this adjusted mobility score provides a more informative view of how well schools are serving as ladders that can help students reach the American Dream, which for most is not about reaching the very top but rather gaining a foothold on the upper rungs, where secure, family-sustaining jobs are found.
It is in that spirit that succeeding in the Social Mobility Tournament represents a reality that needs to be praised and celebrated. Schools with a record of helping the nation’s millions of first-generation and underserved students succeed are not only doing a good thing for their students, they are helping to form strong families, civic-minded communities and thriving local economies.
Our research points out that while many schools that succeed in setting their students on the path to upward mobility are very selective, many are not. For instance, in last year’s tournament, Purdue, Iowa State, Iona and the University at Buffalo, all with admittance rates between 75 and 85 percent, had higher mobility scores than the average of the NCAA Sweet 16.
Others with similar acceptance rates that lost during the First Four or in Round 1 — Old Dominion, Seton Hall, Temple, St. John’s and Saint Mary’s College of California — were also worth mentioning. Not for the prowess they showed in making it to the tournament, but for the praise they deserve for the great work they do in helping their students turn the American Dream into a reality. All these colleges, whatever their size or financial resources, are attending to the needs of at-risk students who are eager to prosper.
To better grasp the importance of what we seek to convey by transforming the NCAA bracket into a bracket based on mobility rates, consider this summary from our report last year. Together, the 68 schools that participated in the 2019 NCAA tournament succeeded in making the intergenerational income leap possible for about 177,000 students out of their total student population of nearly 1.6 million — an impressive 11 percent. But even more impressive, these 177,000 students represent almost 60 percent of the 306,000 who attended these colleges while their parents’ income was in the bottom 40 percent of wage earners. Clearly, these colleges and universities as a group have contributed mightily to their students’ efforts to achieve family-sustaining wages.
But just as performance on the court varies across the high-performing basketball teams, so have the schools’ contributions to the American Dream. Some universities are simply not engines of upward mobility for those who need it most; some are not helpful because they enroll too few low-income students, others because they fail to get their students to complete their studies. Consequently, knowing which schools do or do not serve as escalators to the top is important, and our Income Mobility Bracket aims to shine a light on at least the 68 schools that make it to the Big Dance each year.
In the past three years, the Final Four and ultimate champion in the Social Mobility Tournament have included the following schools:
2017—University of Southern California, St. Mary’s, UC-Davis and the champion, UCLA
2018—Buffalo, Houston, Seton Hall and the champion, UCLA
2919—Virginia Tech, Michigan, Iona and the champion, Villanova
Unlike the NCAA bracket, whose final shape we cannot know until the last tournament game ends, the brackets we create — fully filled out with all the participating teams—have previously been presented shortly after Selection Sunday. This is possible because they are based not on what schools might do but on what they have already done.
Because we will not have the results of the NCAA tournament this year, in a subsequent report we will present a bracket based on schools drawn from computer simulations, the last rankings of teams and the speculations of widely read bracketologists. We will then map these schools onto our alternative Social Mobility Bracket.
As we prepare the calculations for the 2020 Social Mobility Bracket, we will also be doing regression analyses that will yield both mobility rates and predicted mobility rates based on each college’s characteristics. By calculating the difference between the observed and the expected mobility rates, it will be possible to identify for the first time both the winners (those schools that did better than expected in moving their students upward) and the losers (those that did worse than expected). This will add an important dimension to our understanding of what colleges really are doing when it comes to their responsibility to be generators of student financial mobility.
In short, as we noted in 2018, March Madness has indeed been a great escape, but social mobility is the great escape.
Jorge Klor de Alva is the president of the Nexus Research and Policy Center. He was previously a senior executive at Apollo Education Group, Inc., and a professor at Princeton University and the Class of 1940 Professor at the University of California, Berkeley.
Get stories like these delivered straight to your inbox. Sign up for The 74 Newsletter
Jorge Klor de Alva is the president of the Nexus Research and Policy Center. He was previously a senior executive at Apollo Education Group, Inc., a professor at Princeton University, and the Class of 1940 Professor at the University of California, Berkeley.
contributors@the74million.org