Manno: Inside the College Mobility Report Cards That Track Economic Success for Low-Income Students — With Lots to Say About Access, Earnings & Race

;)
Untangle Your Mind!
Sign up for our free newsletter and start your day with clear-headed reporting on the latest topics in education.
Is college a pathway to economic mobility?
Studies generally show that over a lifetime, college graduates amass a wage premium — earn more — and are more likely to participate in civic activities, as well as be healthier and happier, than those who have less than a college degree. Their kids commonly enjoy a host of childhood benefits and better life outcomes. The College Board’s Education Pays report documents the benefits that accrue to individuals with different levels of education, including a college degree.
These findings have led many to argue persuasively that a college degree is a surefire way to upward social and economic mobility — i.e., becoming a member of the middle class and beyond — especially for young people from low-income backgrounds.
Is it possible to measure whether students from low-income backgrounds who graduate from a specific college are, in fact, moving up the economic ladder?
Mobility report cards provide a novel snapshot of how individual colleges are promoting or hindering long-term economic success and prosperity for low-income students. Rather than focusing exclusively on college graduation as a success metric, this approach emphasizes intergenerational upward economic mobility, the degree to which children economically exceed, or lag behind, their parents.
Imagine the difference such a tool would make at a high school student’s meeting with a college counselor.
Opportunity Insights Harvard economist Raj Chetty and colleagues have developed mobility report cards for individual colleges by analyzing anonymous large data sets for more than 30 million college students between 1999 and 2013. A college’s upward mobility rate is calculated by multiplying an access rate (proportion of students in the bottom 20 percent of income distribution) and success rate (proportion reaching the top 20 percent) to determine the percentage rising from the bottom income quintile to the top quintile.
Three key findings on access, earnings and race emerge from these mobility report cards.
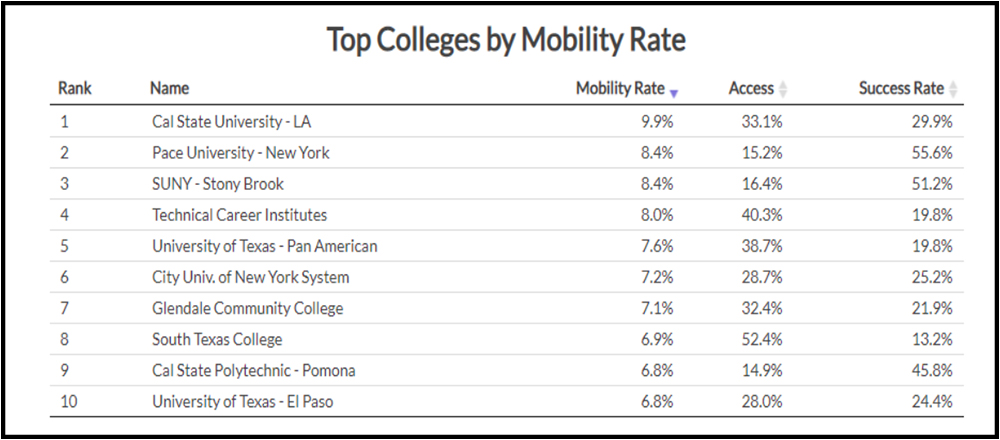
First, mobility rates differ across institutions because low-income students’ access to them varies significantly by family income. For example, 16 percent of SUNY-Stony Brook students are from the bottom income quintile, compared with a 4 percent average at elite institutions like Harvard or Stanford, even with their generous financial aid awards.
Rates of bottom-to-top quintile mobility are highest at mid-tier universities like Cal State-L.A., Pace University and SUNY-Stony Brook, the top three institutions by mobility rate.
Rates of upper-tail — bottom quintile to top 1 percent — are highest at elite institutions. Regrettably, between 2000 and 2011, the fraction of low-income students at mid-tier institutions with high mobility rates fell sharply, though it held steady at elite institutions.
Second, children from low- and high-income families have similar earnings outcomes at any given college. For example, about 60 percent of Columbia University students from both low- and high-income families reach the top 20 percent of earners. This suggests institutions can create a level playing field for students with different socioeconomic backgrounds, so students generally are not mismatched to their selective institutions.
Chetty believes increasing access to high-mobility mid-tier institutions is a sure way to expand upward economic mobility and earnings for many low-income students, since annual instructional expenditures average less than $6,500 per student, compared with elite colleges that average $87,000 per student. His analysis of these mid-tier colleges has identified what The New York Times calls “America’s great working class colleges,” able to educate students from low and modest income backgrounds, propelling them to the middle class and beyond.
Third, the report card reveals significant differences in mobility by race. For example, black and Native American children have substantially lower rates of upward mobility, leaving them “stuck in place across generations.” Tragically, black children born into the top 20 percent income distribution are almost as likely to remain there as fall to the bottom 20 percent — though that income gap seems driven by differences in men’s outcomes, not women’s. Hispanics across generations move up in income distribution, with mobility rates just below those of whites, and Asians have the highest level of upward mobility.
Chetty’s analysis — groundbreaking in many respects — has its limits and critiques. One is that it’s descriptive and doesn’t explain the causes of these mobility outcomes. For example, what postsecondary courses, majors or support services contribute to the upward trajectory?
Another is that Chetty doesn’t create an accurate pool of students for determining who counts as low-income, focusing only on the bottom quintile and intergenerational mobility.
Nevertheless, this analysis raises significant issues and questions for education. For example, how can these findings on student mobility inform high school counseling and postsecondary admissions to better match high school graduates to institutions that fit their backgrounds?
College can be a significant engine of economic opportunity and social mobility — something that despite their best intentions, many “Top Colleges” lists ignore. Chetty’s mobility report cards embody a new college success metric and illustrate that many postsecondary institutions are providing a pathway to prosperity for low-income students.
Manno is senior adviser for the Walton Family Foundation’s K-12 Program.
Disclosure: The Walton Family Foundation provides financial support to The 74.
Help fund stories like this. Donate now!
Bruno V. Manno served in several senior positions in the U.S. Department of Education from 1986 to 1993. He is now senior adviser for the Walton Family Foundation’s K-12 program and co-author of Charter Schools at the Crossroads.
contributors@the74million.org