Castillo: Across the U.S., There Are Stark Differences in Opportunity for Students. Accessible Data Tools Can Illuminate These Gaps

;)
Untangle Your Mind!
Sign up for our free newsletter and start your day with clear-headed reporting on the latest topics in education.
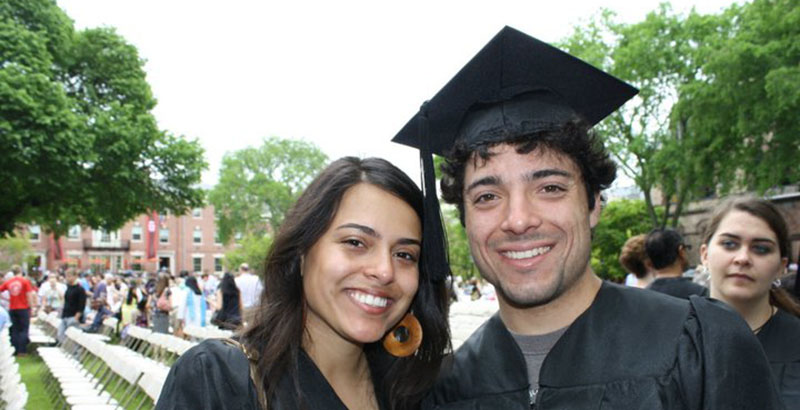
At Brown University, I found my two loves: my love for education policy and data, and my husband. When I first met Drew, I thought he was like most Brown students — and I was right. He was (still is) nice, smart and white, and he graduated from some of the best public and private schools in the country. As we began to get to know each other, I learned that he grew up in Chatham, New Jersey, an affluent white suburb of New York City.
Chatham is unlike my hometown of Commerce, California, where most people look like me, speak Spanish and either are immigrants or have parents or grandparents who are. When I first visited Chatham, it reminded me of the perfect setting for all the Disney Channel movies I watched as a child. I didn’t realize those places actually existed.
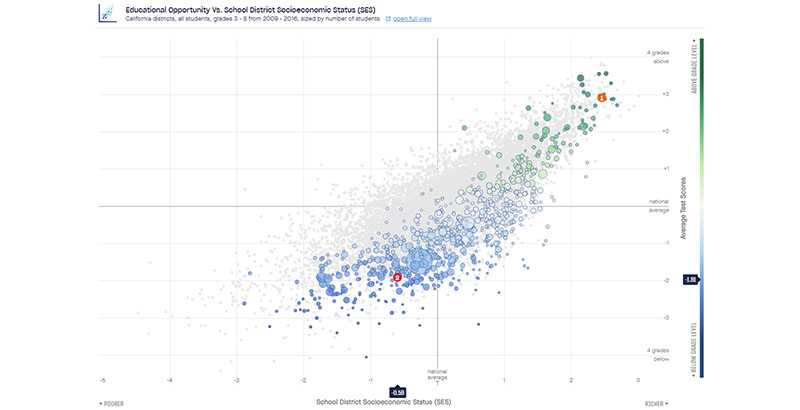
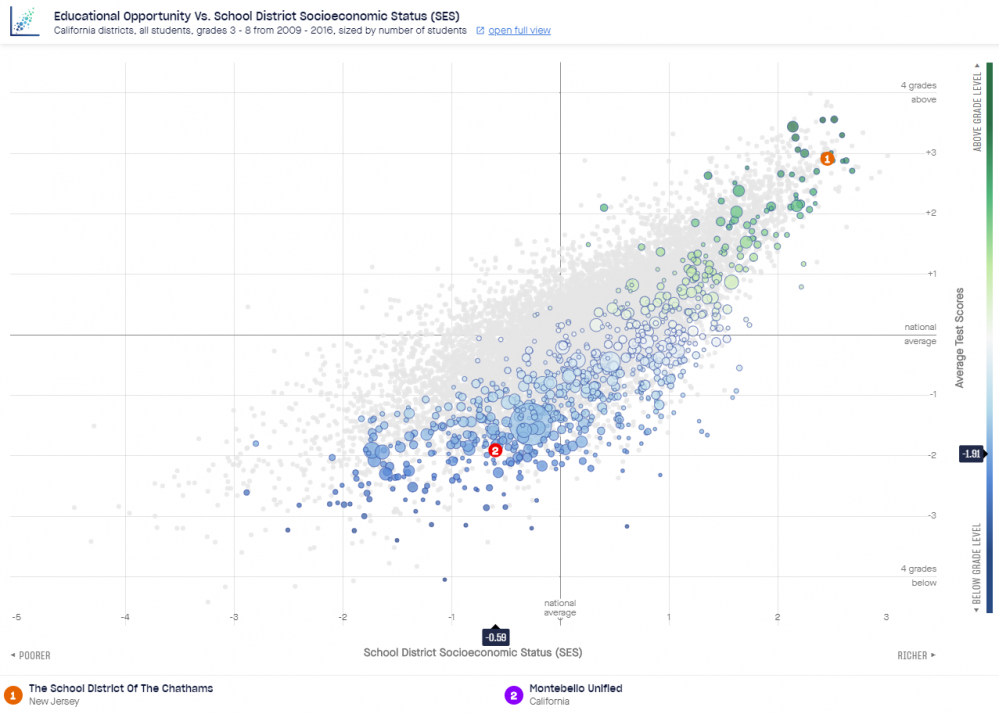
The differences between Chatham and Commerce come into sharp relief with new data tools such the Opportunity Explorer by the Education Opportunity Project at Stanford University. This tool allows users to search for all schools in the nation and compare them using the same metrics. The disparities between Chatham and Commerce are alarming. Test scores in my hometown’s school district (Montebello Unified), for example, were 1.91 grade levels below the national average, while Chatham’s were almost three grade levels above (2.91) — a total difference of almost 5 grade levels. The tool also calculates annual learning rates, which are a better way to assess school quality than simply comparing test scores. This is because test scores are influenced by many factors outside of school. On average, each year, students from Commerce learned 23 percent less than students in Chatham did.
The chart below shows (1) the School District of the Chathams in comparison to where (2) Montebello Unified (Commerce) lies relative to all California schools, using Stanford Education Data Archive national test scores and socioeconomic status.
Another user-friendly data source for examining starting points and illuminating unequal opportunities is the U.S. Census Bureau’s American FactFinder. While my hometown’s bachelor’s degree attainment rate was 8 percent in 2017, Chatham’s was 76 percent — a difference of 68 percentage points. The 2017 median family income in Commerce was $50,135, compared with Chatham’s $220,281, a yearly income gap of more than $170,000.
Drew is not an anomaly. Like most of my former Brown classmates, he grew up in a neighborhood and a household that afforded him many opportunities. In addition to a high-quality education, my college peers received piano, tennis, swimming and sailing lessons, to name just a few out-of-school experiences. Compared with students from low-income homes, those from middle-income backgrounds participate in 6,000 more hours of out-of-school activities by sixth grade.
These data points underscore stark differences in opportunity across this country. I worry how students from Commerce (or Newark or west Philadelphia) will ever compete with students from Chatham (or Greenwich or West Los Angeles) for college admission, internships and, ultimately, jobs.
Yet I am proof that it is possible to compete. I credit both my parents and my community. My parents never told me to work hard; they showed me. I learned from their relentless work ethic as day laborers unloading trucks, a literally backbreaking job. My local public library in Commerce provided me with access to endless information, including books on how to get accepted to college and financial scholarships available from undergraduate through graduate school.
As more and better data are developed about students’ experiences — and solutions to the opportunity gaps the data illustrate — we must be mindful that learning experiences also occur outside school walls. Data collection systems and policies should reflect that. If researchers overlaid Stanford’s data with other data sets, including early childhood, school funding, afterschool, postsecondary, census and civil rights data, they could create a clearer representation of how opportunity gaps begin and persist. For example, we would be able to further understand the relationship among district offerings, funding and afterschool opportunities. We could then examine how these factors influence test scores and, later, postsecondary outcomes. States like Kentucky are leaders in this effort creating longitudinal data systems from early childhood through the workforce.
Policymakers at the local level could also use these user-friendly data tools to understand opportunity gaps within districts. For example, U.S. Department of Education Office for Civil Rights data show that in my high school, a higher percentage of Asian than Latinx students took calculus, even though Asians comprise only 8 percent of the student body and Latinx students make up 90 percent. Local policymakers can use these data to strategically change opportunity structures specifically for math course enrollment. They can work to create pathways via high-quality math instruction starting in elementary school and provide additional supports during crucial transitions (e.g., eighth grade to ninth grade). Similarly, parents and community members can use these data points to advocate on behalf of their students to ensure not only that pathways into advanced math courses exist, but also that extra supports are available to meet students’ needs both inside and outside of school.
Entering college, I had no idea that opportunity gaps existed. Learning about educational inequities and privilege inspired me to pursue a career in education. My goal now is to ensure that data and rigorous research inform policymakers, educators and communities, as they work to develop effective solutions.
Wendy Castillo, Ph.D., is a research associate at the Research Alliance for New York City Schools at New York University and a lecturer at Princeton University’s Woodrow Wilson School of Public and International Affairs. She is a proud native of Southeast Los Angeles and the daughter of immigrants.
Get stories like these delivered straight to your inbox. Sign up for The 74 Newsletter
Wendy Castillo is a lecturer at Princeton University and an expert in QuantCrit, the intersection of data, education, social justice and critical race theory.
@wcastillophd contributors@the74million.org