Analysis: School Repairs? New Instructional Materials? How Districts With Different Poverty Levels Are Spending COVID Relief Funds

;)
Untangle Your Mind!
Sign up for our free newsletter and start your day with clear-headed reporting on the latest topics in education.
Help fund stories like this. Donate now!
For decades, many school districts with the largest share of students living in poverty have endured crumbling buildings, outdated textbooks and little support for students and teachers. Now, the infusion of billions in federal COVID relief aid for schools over the next few years could change that reality.
A new FutureEd analysis of plans released by more than 2,600 school districts serving 53 percent of the nation’s public school students suggests that the higher the poverty rate in a district’s student population, the more likely its administrators are to devote the federal aid toward renovating aging ventilation systems and other repairs to schools. Likewise, the higher the poverty rate, the more likely a district is to use relief aid for new instructional materials, ranging from writing supplies to culturally relevant curricula.
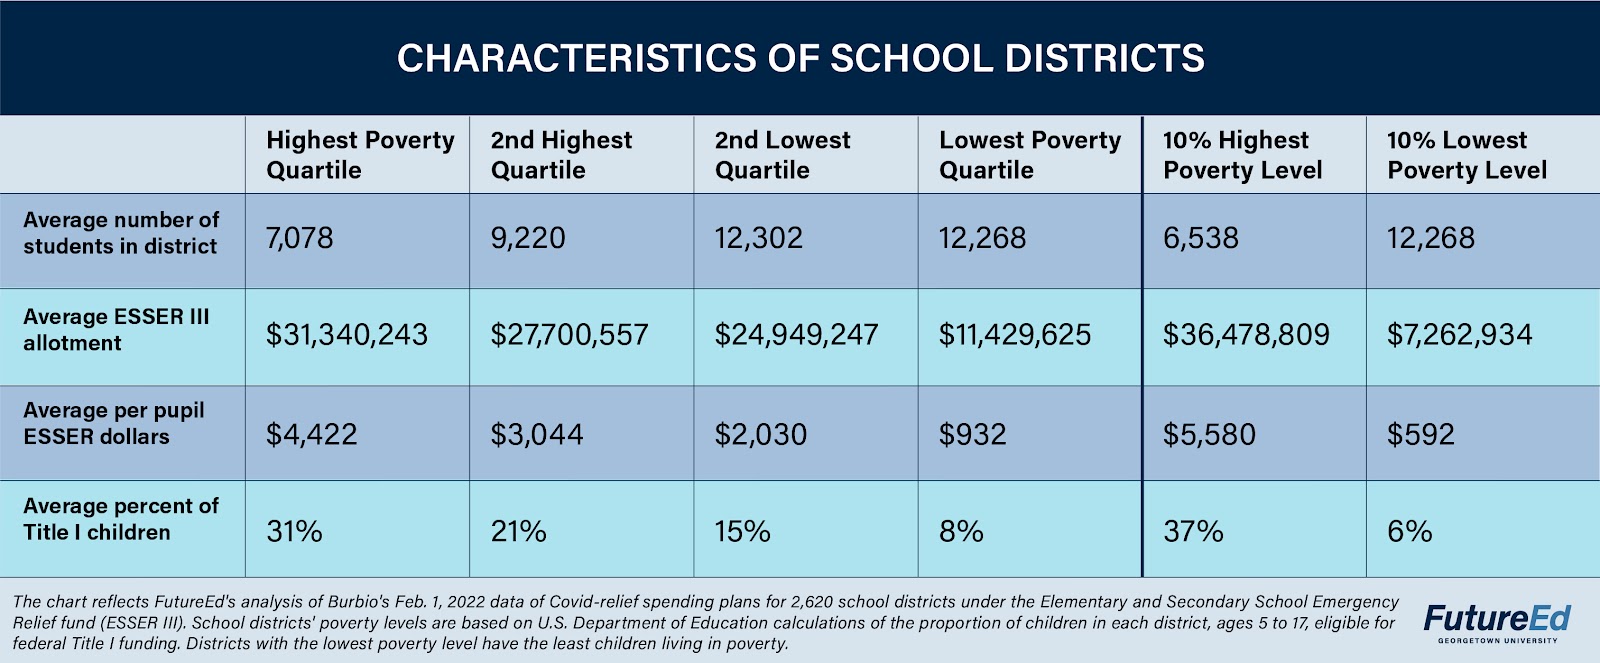
The analysis is based on a compilation of the plans of school districts spending about half of the $122 billion allotted for K-12 schools in the third round of the federal Elementary and Secondary School Emergency Relief fund (ESSER III). We combined that information collected by the data services firm Burbio with U.S. Department of Education figures showing the proportion of children in each district, ages 5 to 17, eligible for Title I funding, which supports low-income and vulnerable students.* We excluded about 120 plans from charter school organizations, for which we had no information on poverty levels.
Congress did not set out to fix the problems of under-resourced school districts when it approved the American Rescue Plan last year. But because the money flows through the federal Title I formula, the districts with the greatest concentrations of poverty are receiving far more funding than their more affluent counterparts. The 10 percent of districts in our analysis with the most children living in poverty will spend on average $5,500 per student in ESSER III aid, nearly 10 times more than the most affluent districts.
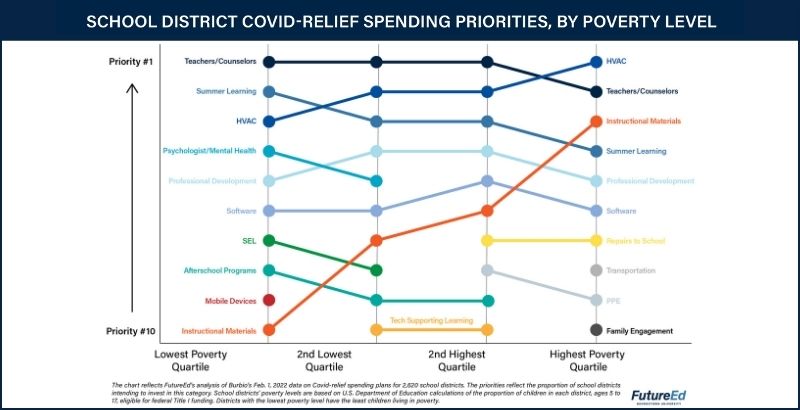
While all districts have made hiring and paying academic staff a top spending priority — it’s the No. 1 choice in the more affluent districts and No. 2 among the highest-poverty quartile — other choices vary widely, depending on poverty levels.
Facilities repairs and upgrades
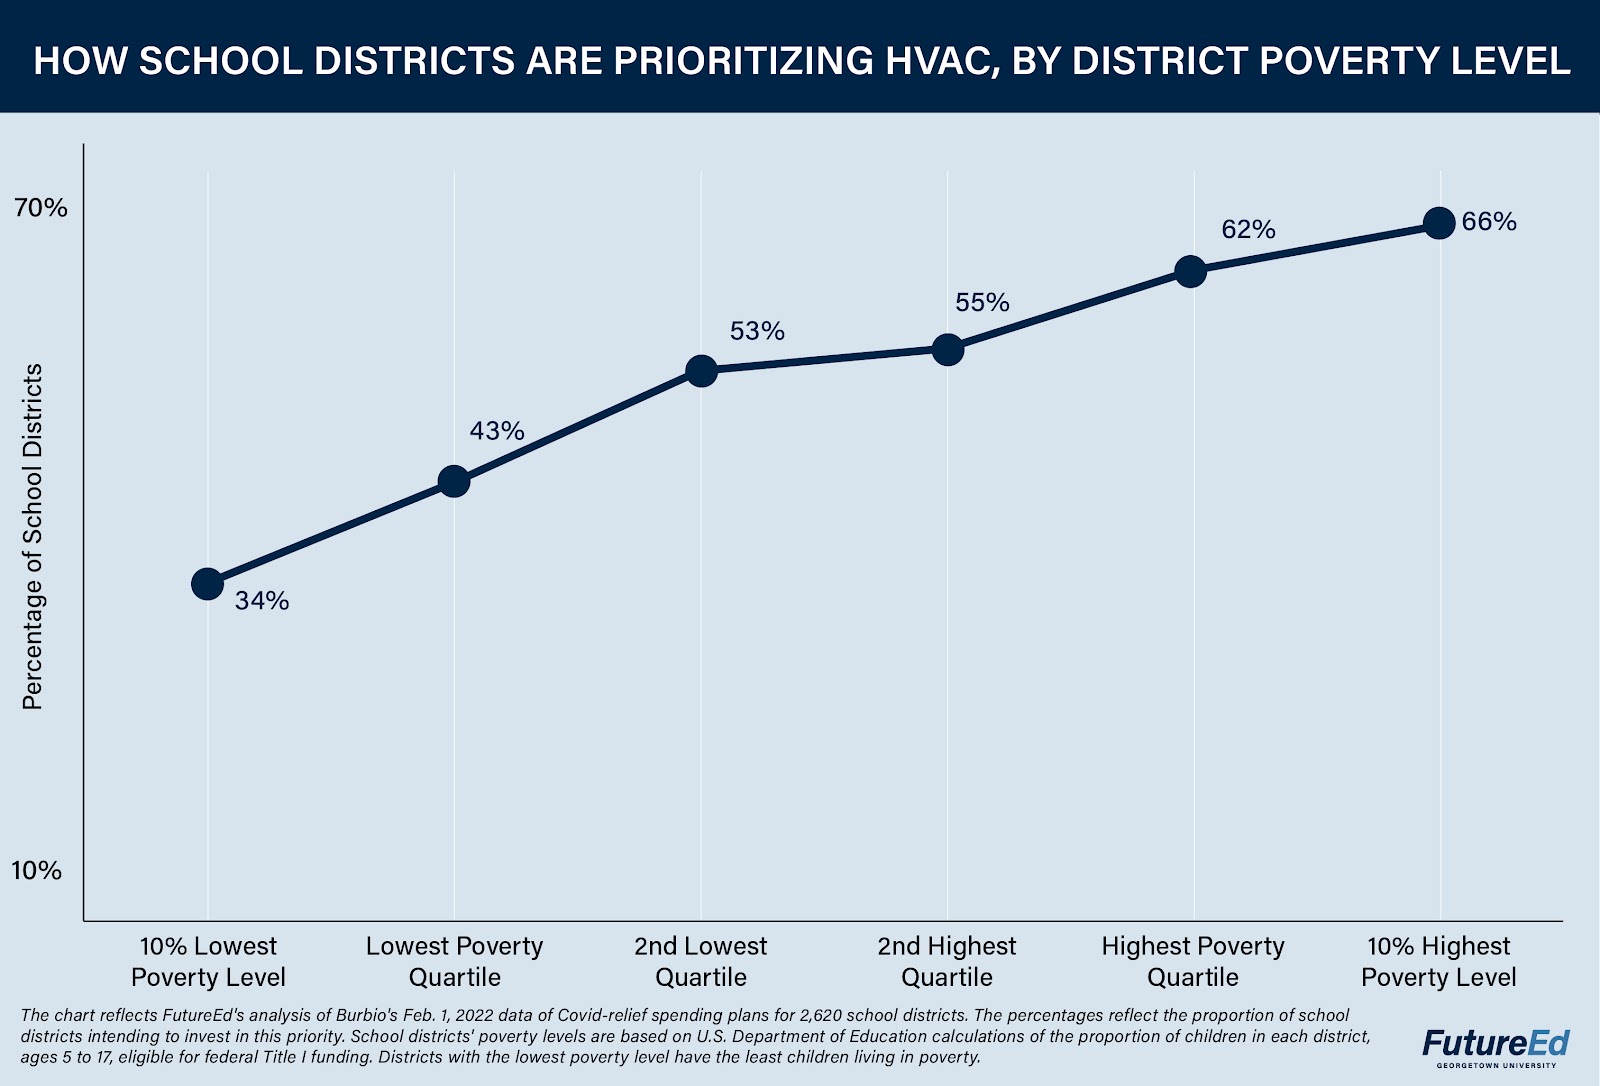
Consider plans for improving heating, ventilation and air conditioning systems, an allowable use for the federal aid since COVID-19 is an airborne disease. About a third of the most affluent districts — the top 10 percent in the sample — plan to spend ESSER III money on upgrades, making it the fifth-highest priority for that group. For the 10 percent of districts with the most children in poverty, HVAC is the No. 1 priority, with about two-thirds of the districts investing in improvements.
This spending would go beyond simply mitigating the spread of viruses. Dallas County, Alabama, where more than a third of the 2,900 students live in poverty, has set aside $6 million to replace all HVAC systems 15 years and older, representing just under a third of its ESSER III money. Baltimore City Public Schools in Maryland is planning to spend nearly $47 million, about one-tenth of its allotment, to upgrade units in six schools and install an entire system in a new high school. The district, where a third of the 79,000 students qualify for Title I services, has long struggled with faltering infrastructure and has actually shut down schools on days when temperatures were too hot or too cold.
Nationwide, as many as 36,000 schools need to upgrade their HVAC systems, according to a 2020 report from the U.S. Government Accountability Office. The report did not break down the data by poverty level but found that schools serving high concentrations of students living in poverty spent, on average, $300 less per student on capital projects than the wealthiest districts in a single year.
Now, with the infusion of federal aid, school districts in the highest-poverty quartile of the Burbio sample are spending on average $559 per pupil on HVAC upgrades, far more than the $176-per-pupil figure for those in the most affluent quartile.
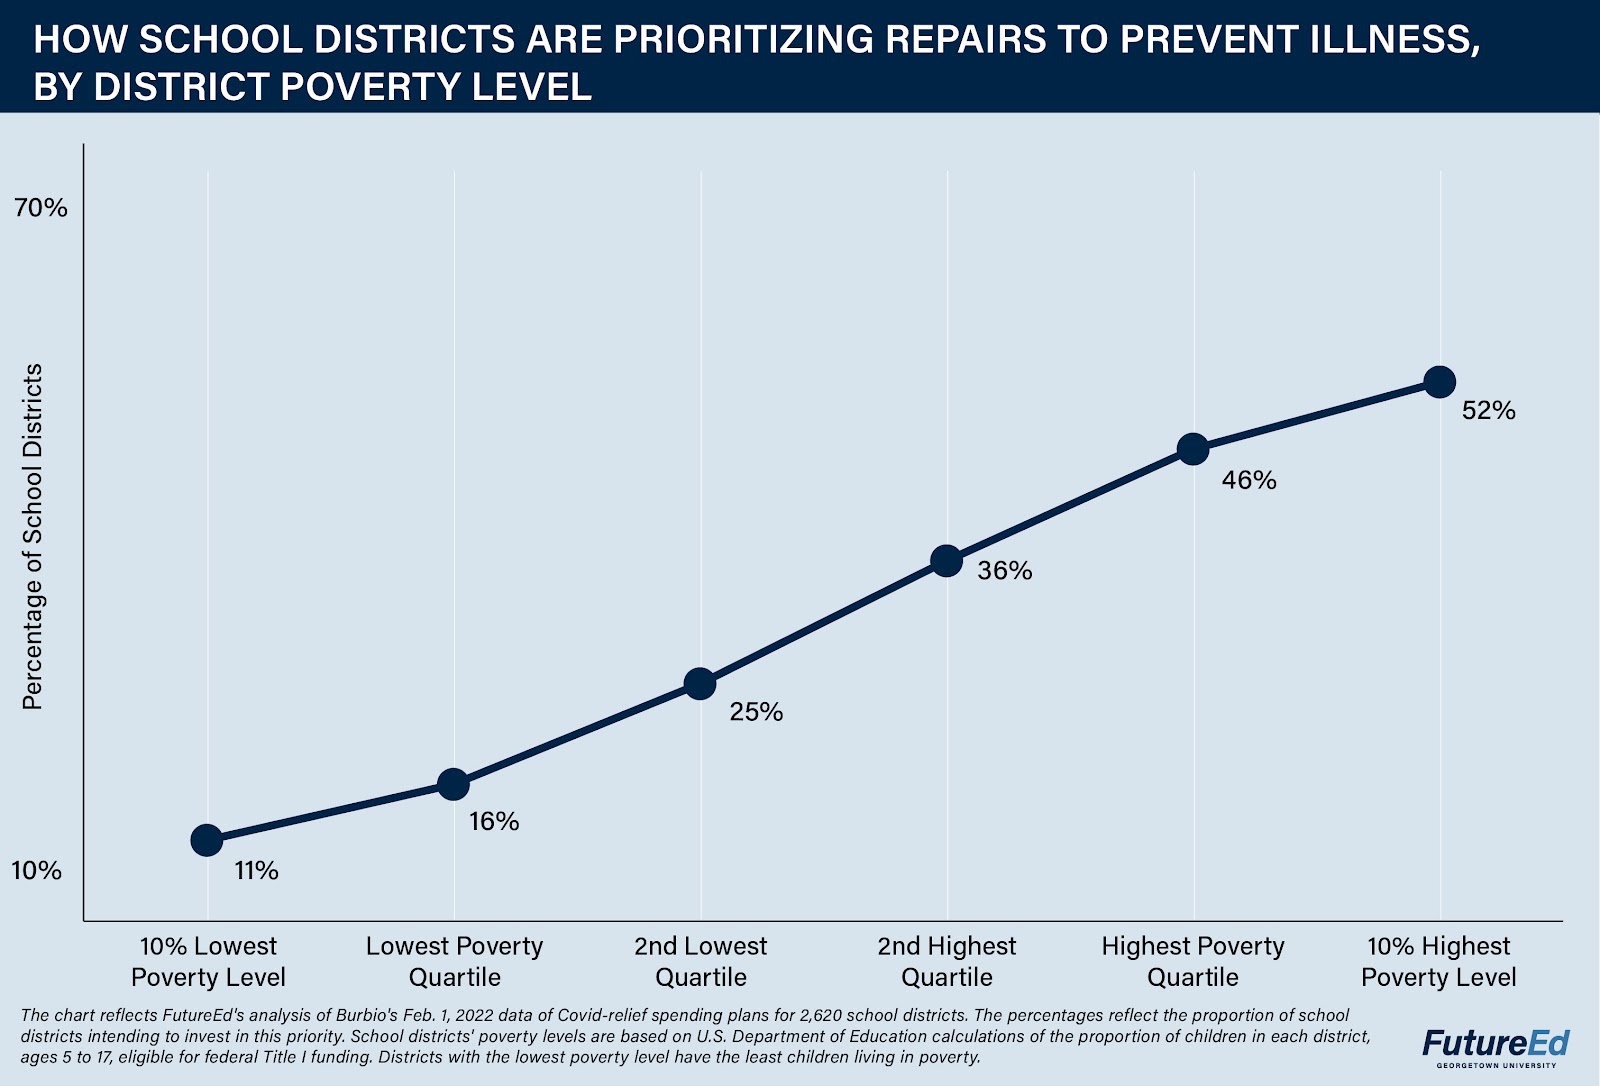
Beyond HVAC, low-income school districts are also more likely to plan investments in what Burbio classifies as repairs that “reduce the risk of illness.” This spending category doesn’t appear among the top 10 priorities for the most affluent half of schools in the sample. But nearly half of the districts in the poorest quartile and more than half those in the poorest 10 percent plan to spend in this category.
The highest-poverty quartile includes Atlanta, where the 52,400-student district intends to put $2 million toward lead water testing systems, a small proportion of its $200 million allotment. In Anniston, Alabama, where 37 percent of students are Title I-eligible, administrators are planning to replace a roof at a high school to deal with moisture intrusion and humidity issues. The repair work forms part of a $5 million investment in infrastructure needs that the 1,800-student school district is making with its $12 million ESSER III money.
Some big city districts with high-poverty populations expect to use a portion of their allotment to supplement their existing capital improvement budgets: Detroit is putting about a quarter of its $800 million toward that purpose, and Philadelphia is devoting about a third of its $1.1 billion.
The idea of spending any COVID relief money on capital improvements angers some education analysts because it doesn’t seem connected to the academic recovery the federal aid was designed to achieve. But ultimately, better facilities can lead to better student outcomes, notes Zahava Stadler, a school finance expert at The Education Trust.
Research shows that learning suffers when students are too hot or too cold in the classroom. Mold and mildew contribute to absenteeism, especially for students with asthma — the No. 1 cause of student absences before the pandemic. Exposure to lead, through contaminated water or peeling paint, can contribute to learning delays and behavioral problems. Fixing these problems can ultimately create safer, healthier learning environments.
Academic priorities
A lack of quality instructional materials is also a chronic problem for under-resourced school districts. Anecdotal accounts of outdated history books showing George W. Bush as president underscore a broader concern about the inequitable distribution of resources. In lawsuits from New Jersey to California, courts have ruled that states need to do more to ensure that districts with the largest populations of low-income students have high-quality textbooks, facilities and teachers. A number of states have changed their school funding formulas in a bid to ensure more equitable resources.
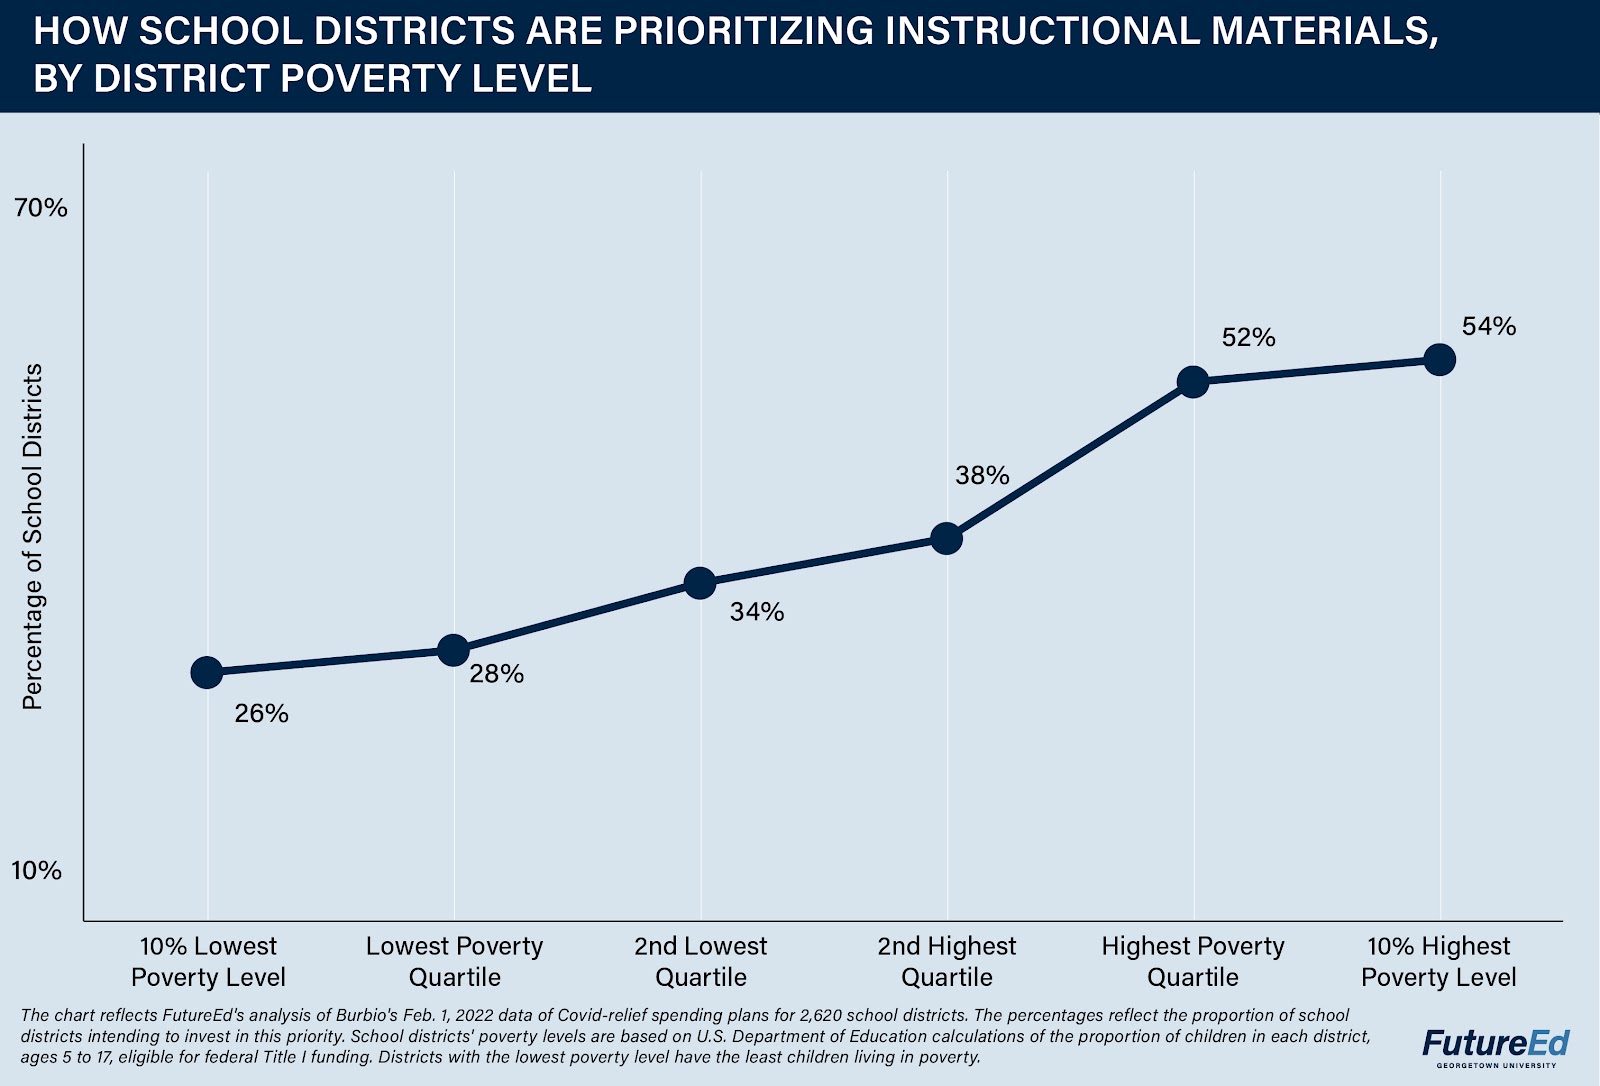
The infusion of federal COVID relief money gives districts a chance to further narrow resource gaps. More than half of the districts in the highest-poverty quartile are planning to invest their federal aid in instructional materials, making it the No. 3 priority behind HVAC and academic staff. By contrast, barely one-fourth of the most affluent quartile intend to spend on such materials, and it ranks as their No. 10 priority.
These investments yield tangible resources that districts can rely on after the pandemic has ended and the ESSER money has run out. The Helena-West Helena School District in Arkansas, where 54 percent of the 1,200 students live in poverty, plans to put $600,000 toward curricular expenses, including new science textbooks and mobile science labs.
The Phoenix, Arizona, school district, where the poverty rate among its 6,200 elementary students is 33 percent, plans to allot $795,000 for early learning workbooks, math and English learning games, books for classroom libraries and social-emotional support materials, such as stress balls, Play Doh, gel pens and coloring books. In Detroit, where 42 percent of the 50,600 students qualify for Title I services, administrators are planning about $18 million in spending on supplemental instructional materials, including new technology for connecting students to the internet. In each of these cases, the instructional materials represent a relatively small portion of the districts’ ESSER allotment.
Districts with fewer students living in poverty are more likely to devote their academic spending to afterschool and summer learning programs designed to help students make up for lost instructional time during the pandemic, our analysis shows. Given the uneven impact of the pandemic, these districts may have fewer students who need help with academic recovery. In that case, it may make sense to focus the more limited federal funds on programs that can be targeted to the students who need support, says Jonathan Travers, a managing partner at Education Resource Strategies who advises school districts.
To be clear: The districts with more children in poverty are also spending on extended learning time. Roughly a third of districts overall have earmarked funds for afterschool programs, and about half are planning to spend on summer learning programs. But districts in the highest-poverty quartile are more likely to put a greater share of their funds toward instructional materials ($253 per pupil on average) than toward other academic priorities, such as afterschool programming ($241 per pupil) and summer learning ($216).
Among the most affluent quartile of districts, summer learning is the No. 2 priority and accounts for $110 per pupil in proposed spending — considerably more than the $62 allotted per pupil for afterschool programs and the $48 for instructional materials. In contrast, summer learning is the No. 4 priority in the highest-poverty quartile and falls to No. 8 among the 10 percent of districts with the highest poverty rates.
Student mental health
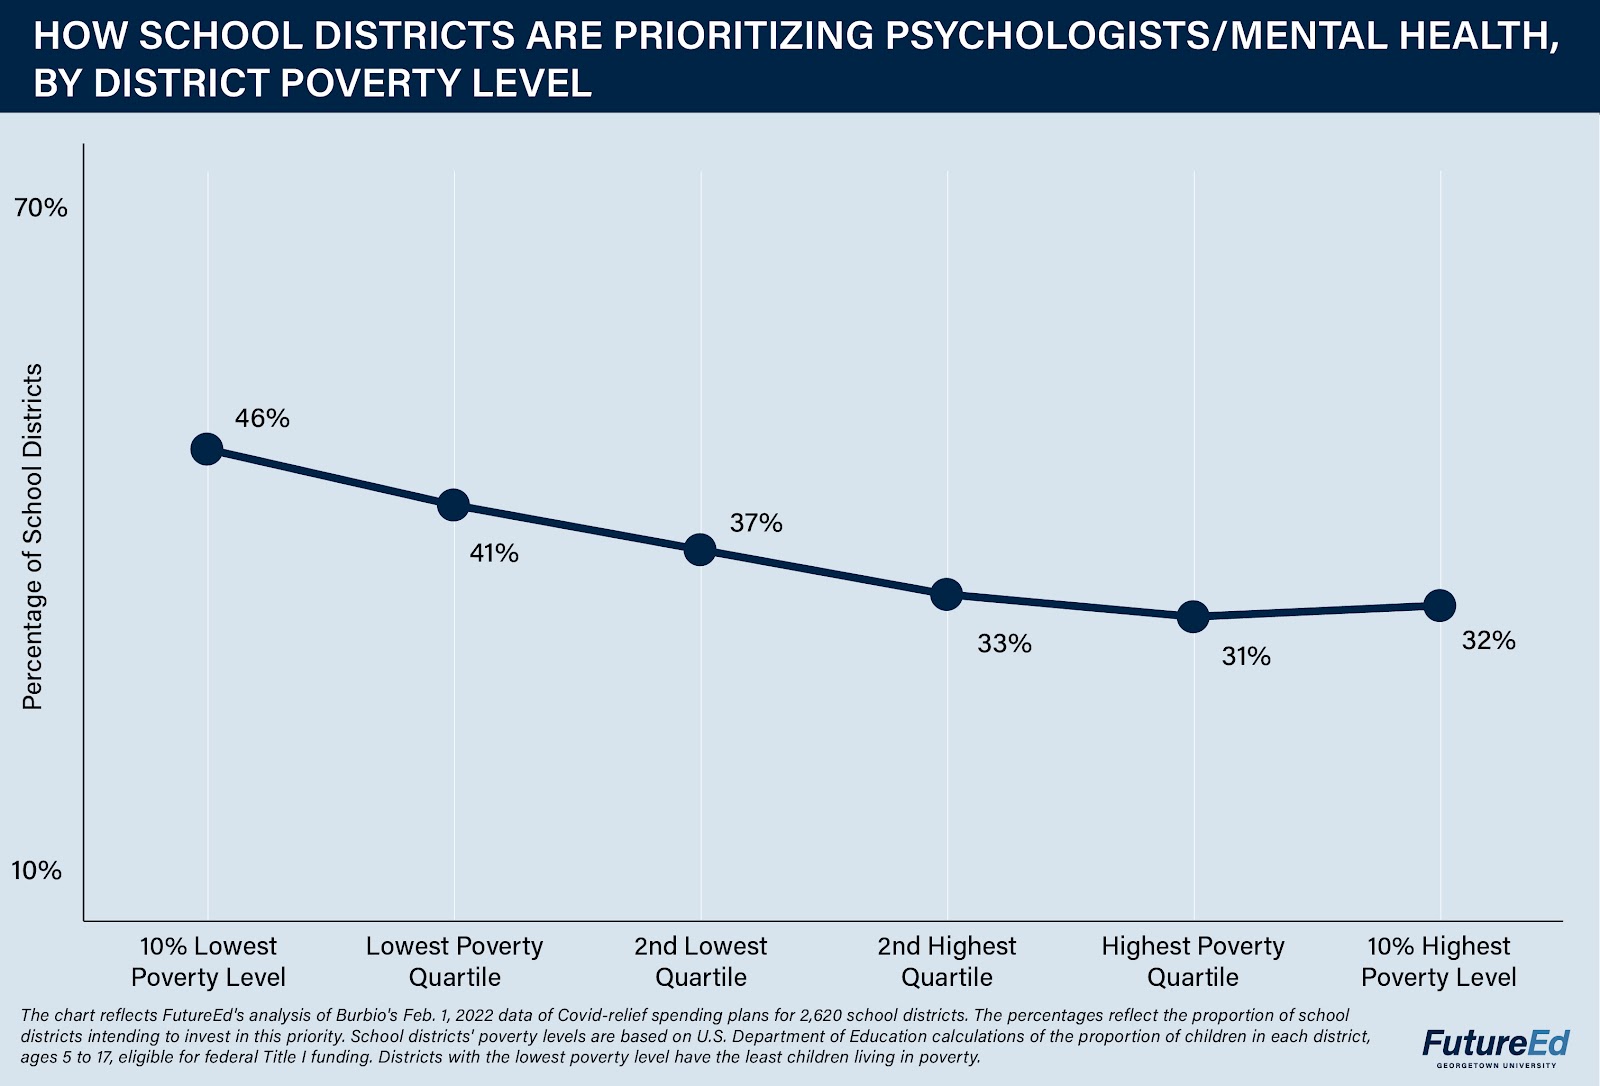
Another area where low-poverty districts are more likely to spend COVID relief money than their high-poverty counterparts is mental health services.
About 41 percent of the most affluent quartile of districts — and 46 percent among the top 10 percent — are earmarking money to provide psychologists and other mental health professionals to help students and staff deal with pandemic-related trauma, compared with 31 percent of the highest-poverty quartile and 32 percent of the highest 10 percent.
In suburban Simi Valley, California, where 7 percent of children are eligible for Title I services, the 16,600-student unified school district is planning to spend about $7.4 million, more than half its ESSER III allotment, on mental health professionals. In Kings Park on Long Island, New York, the 2,900-student district is dedicating roughly a third of its $1 million allotment toward hiring an additional elementary social worker for the next three school years. About 5 percent of the students there are Title I-eligible.
This spending trend dovetails with what we found in breaking down the Burbio sample by rural and urban settings: Rural districts are far less likely to make mental health a spending priority. That may be because there are fewer mental health professions in rural communities.
Spending planned for social-emotional learning materials and training is fairly consistent across the sample, with about a third of districts at all poverty levels earmarking funds. That proportion ranks it among the top 10 priorities for the more affluent half of school districts but not for the communities with more children in poverty.
In many ways, the spending patterns reflect a hierarchy of needs, with under-resourced districts more likely to commit COVID relief funds to tangible improvements addressing chronic problems and wealthier districts dealing with the immediate impacts of the pandemic.
The trends could well change in the nearly three years that localities have to use the federal money. During the Omicron surge, many districts rushed to spend on masks, rapid tests and cleaning supplies, and it’s unclear when they may need to do so again. Still, the plans that districts are submitting so far suggest that this historic infusion of cash could help the most underserved communities recover not only from the pandemic, but from years of disinvestment.
*To create the poverty quartiles, all school districts are ranked, from the highest to the lowest, based on their percentage of Title I-eligible 5- to 17-year-olds. Districts are divided into quarters such that each quarter includes 25 percent of the districts in the Burbio sample.
The count of Title I-eligible children is primarily determined by the number of 5- to 17-year-olds families living below the national poverty measure, estimated through the Small Area Income and Poverty Estimates program of the U.S. Census Bureau. These students account for roughly 97 of Title I eligible children. Title I-eligibility also includes children who receive Temporary Assistance for Needy Families, neglected and delinquent children, and foster children.
The percentage of Title I-eligible children is used to determine the distribution of funds to LEAs and does not equate to the number of children receiving Title I services. Many children receive Title I services through schoolwide programs.
FutureEd, an independent, nonpartisan think tank at Georgetown University’s McCourt School of Public Policy. She is the author of Attendance Playbook: Smart Solutions for Reducing Chronic Absenteeism, released by FutureEd and Attendance Works. Bella DiMarco is a policy analyst for FutureEd. Prior to joining FutureEd, Bella worked at the Afterschool Alliance.
Help fund stories like this. Donate now!
Phyllis W. Jordan is associate director of FutureEd, an independent, nonpartisan think tank at Georgetown University’s McCourt School of Public Policy.
contributors@the74million.org
Bella DiMarco is a policy analyst for FutureEd. Prior to joining FutureEd, Bella worked at the Afterschool Alliance.
contributor@the74million.org