Analysis: NAEP Scores Show D.C. Is a Leader in Educational Improvement — With Powerful Lessons for Other Cities

;)
Untangle Your Mind!
Sign up for our free newsletter and start your day with clear-headed reporting on the latest topics in education.
Updated April 17
The latest edition of the Nation’s Report Card — the 2017 National Assessment of Educational Progress — got a lot of ink last week. While results nationally were a yawn, the scores from Washington, D.C., hold powerful lessons for other cities. Together, D.C. charter and district public schools have improved faster than those of any state over the past decade, by far, while district schools have improved faster than those of any other urban district that takes the exam.
NAEP is widely considered a more reliable measure than state tests because there are no stakes attached, so schools have no incentive to cheat or spend time preparing their students. But because the random sample of students who take the test changes every two years, short-term results tend to bounce around. Looking at a decade or more smooths things out and provides a more trustworthy gauge.
In D.C., that takes us back to the pivotal year of 2007, when the city council did away with the elected school board and gave power over D.C. Public Schools to the mayor, who appointed Michelle Rhee as chancellor. Since then, DCPS has embraced some of the most profound reforms of any traditional district.
Meanwhile, D.C.’s charter sector, which has grown to educate 47 percent of public school students in the city, has won plaudits as the “healthiest charter sector” in the country from the National Alliance for Public Charter Schools.
So D.C. provides a fascinating laboratory. We can compare a rapidly improving traditional district to a vibrant charter sector.
When we do so, two clear lessons emerge. First, a charter sector where authorizers close or replace failing schools and encourage strong schools to replicate produces the most rapid growth, particularly for poor and minority children. Second, competition from such a sector does not disable a traditional district, as many fear, but spurs it to improve.
(Lest one think these realities are limited to D.C., we see exactly the same dynamics in other cities with strong charter authorizers, such as Boston, Newark, Indianapolis, and Denver.)
This is evident from all four NAEP exams: fourth- and eighth-grade English and math. Since 2007, DCPS scores have improved an average of 13 points, outpacing all the other 26 districts that participate in the Trial Urban District Assessment, as well as the national average for cities with more than 250,000 residents. (New Orleans, the most rapidly improving city on other metrics, does not participate in TUDA.) D.C.’s closest competitor has been Chicago, which averaged just under 12 points over the decade.
To put these numbers in perspective, researchers consider 10 points to be roughly the equivalent of a year’s gain in learning — meaning 2017’s test takers in D.C. are about one year and three months ahead of where they would have been back in 2007. D.C. and Chicago have made substantial strides.
D.C. has also improved more than twice as fast as any state over the past decade. (When comparing D.C. with states, NAEP counts both district and charter scores; here D.C.’s improvement has averaged 14 points.) Some of this has been due to demographic changes in the mix of students taking the NAEP test, as white and Hispanic populations in D.C. have grown and the city has become more affluent. Two separate studies have suggested that these factors account for between a quarter and a third of the progress. But even if we discount D.C.’s district/charter gain of 14 points by a third, it still outpaces any state’s.
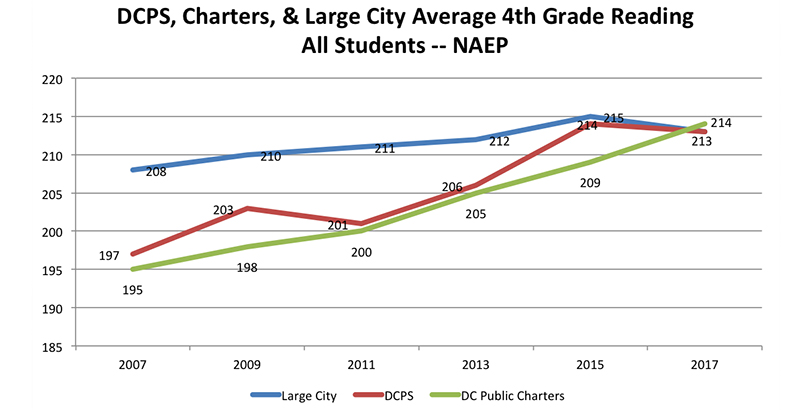
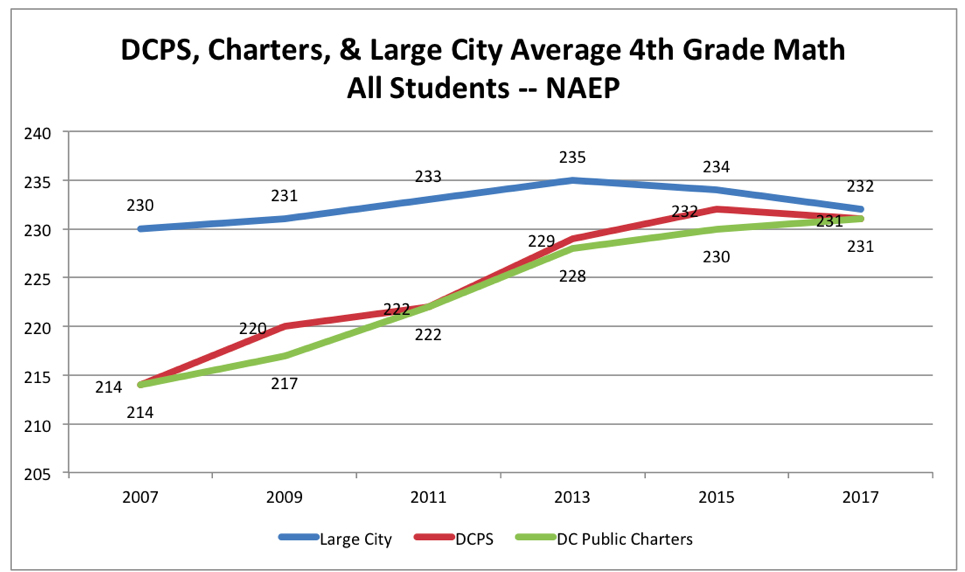
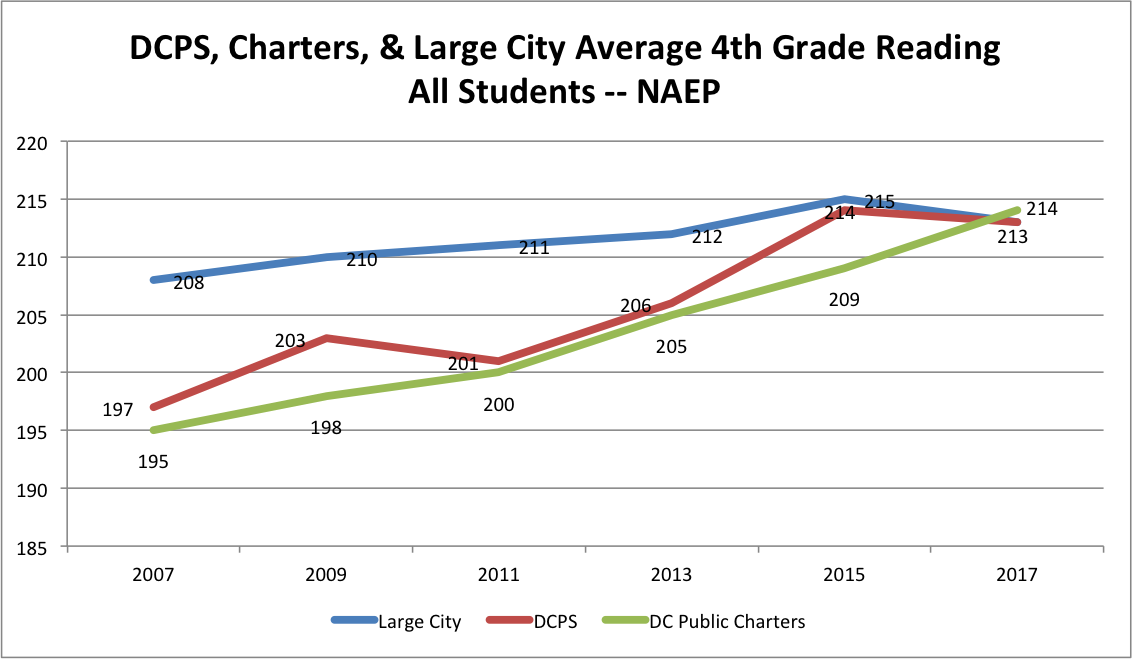
Charters and district schools have improved at roughly the same pace, as the graphs below show.
 But the real insight comes when we dive into these demographics, because charters have done substantially better with African-American students — who make up 68 percent of public school students in D.C. — than DCPS has.
DCPS has far more white students than charters: in 2016–17, 14 percent of DCPS students were white and 62 percent were black, compared with 5 percent and 76 percent of charter students, respectively. DCPS had a higher percentage of English language learners (12 percent versus 8.6 percent), while charters had a higher percentage of students with disabilities (16.3 percent versus 14 percent). Charters received roughly $6,000 to $7,000 less per student than district schools.
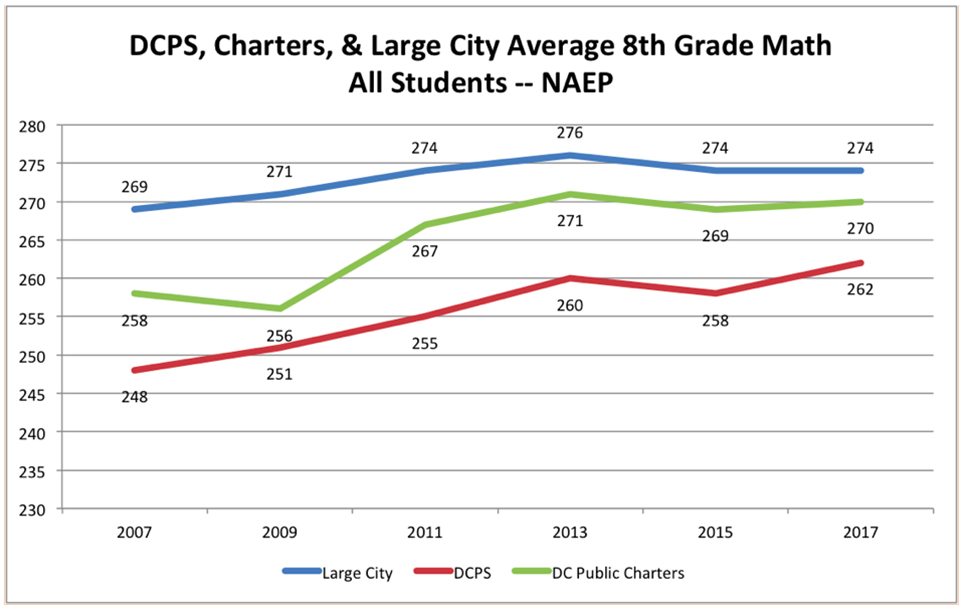
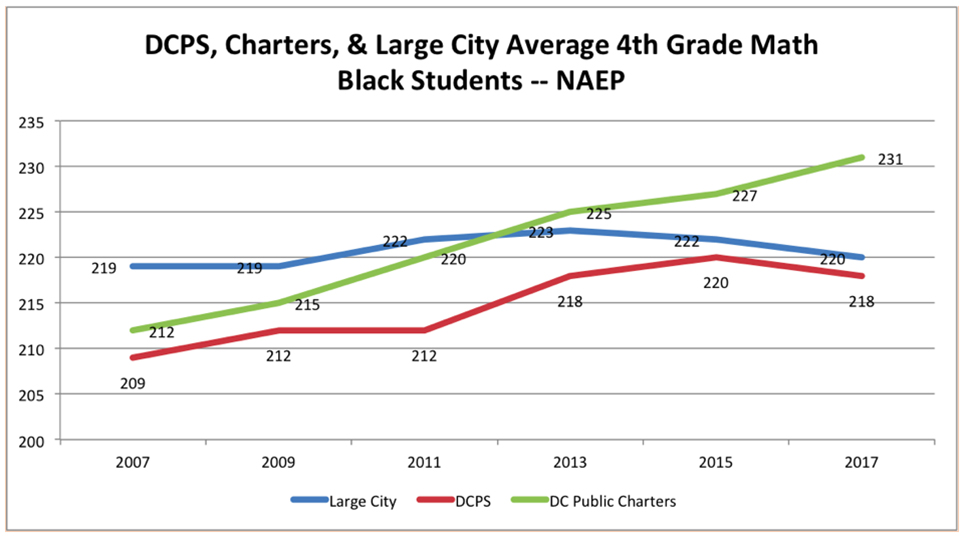
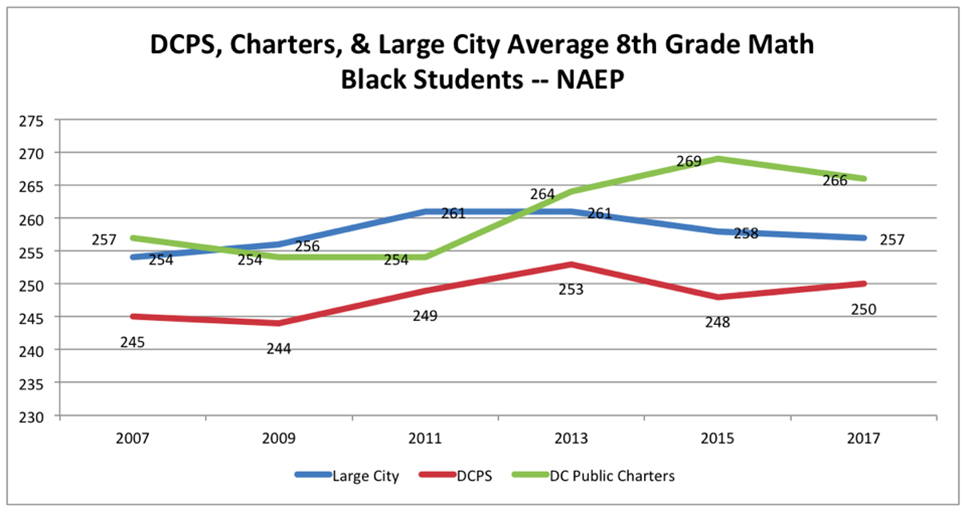
Yet, as you can see from the graphs above, charter and district students performed about the same in fourth grade, while charter students usually performed better in eighth grade.
DCPS’s greatest progress has been with white and middle- and upper-income students. DCPS has seen large gains in average scores across all subjects and all grades for white students and students not eligible for free and reduced-price school lunch. Indeed, of 25 TUDA districts that measured this in 2017, DCPS had the highest scores for whites and the highest gap in scores between white and black students, on all four tests. Eighth-grade black students still ranked 22nd in math and 21st in reading.
The data for low-income students is murky, because NAEP uses eligibility for subsidized meals as a proxy for low income. But since 2012–13, D.C. has given all students in schools with more than 40 percent “at-risk” students free lunch. NAEP data say public charters have performed far better than DCPS with these students, with a smaller achievement gap between those eligible for subsidized meals and those not eligible, but it’s hard to know how accurate those numbers are.
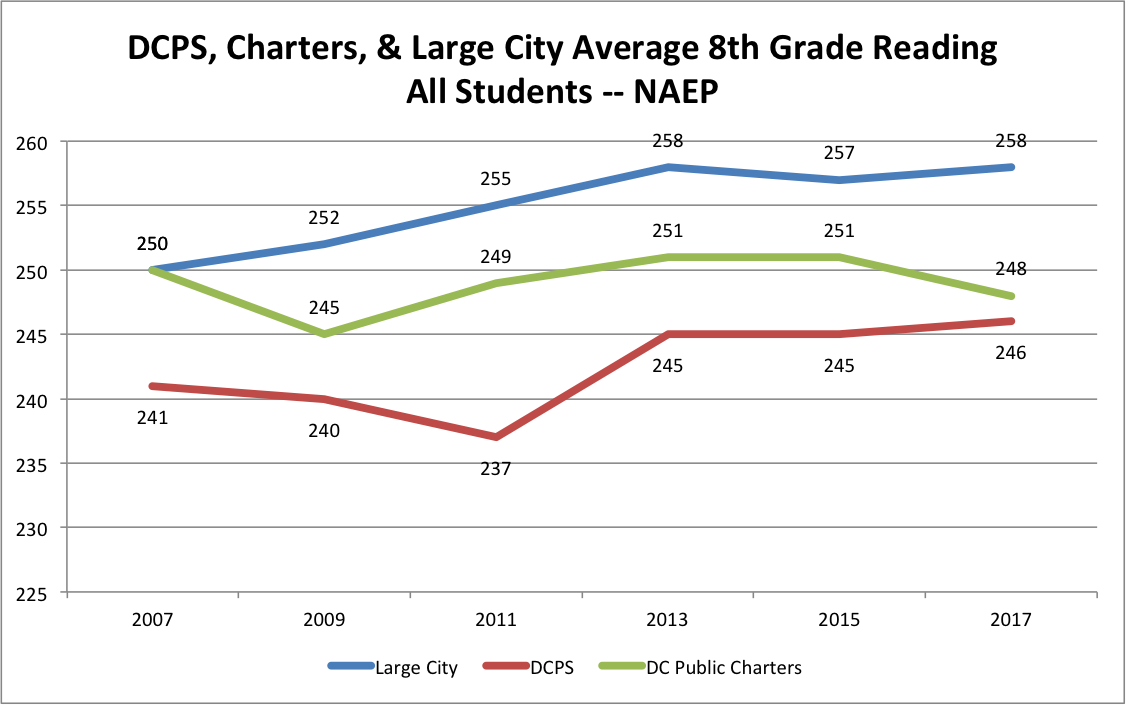
There is no such confusion in the data on race. As the graphs below show, charters have consistently outperformed district schools with African-American students. (We did not include Hispanic students because the samples are small enough that the numbers bounce around, rendering them less trustworthy.)
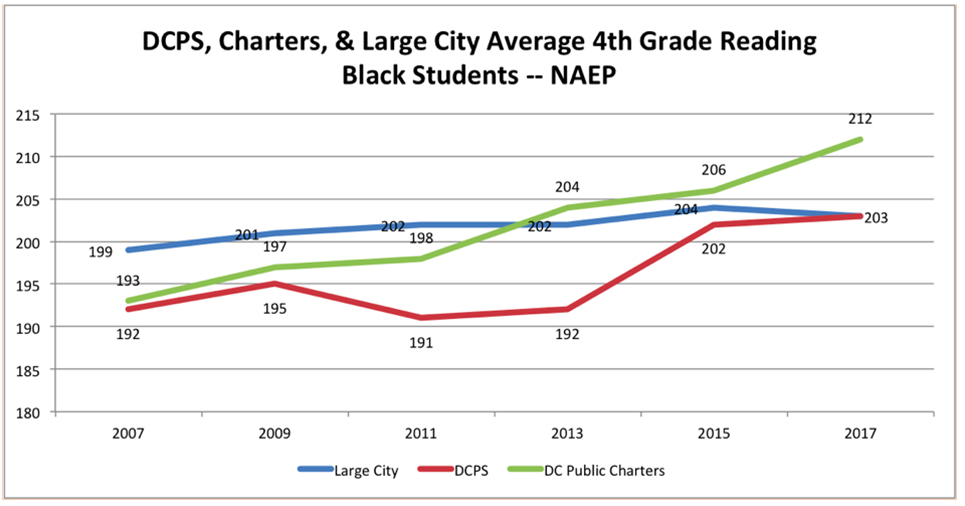
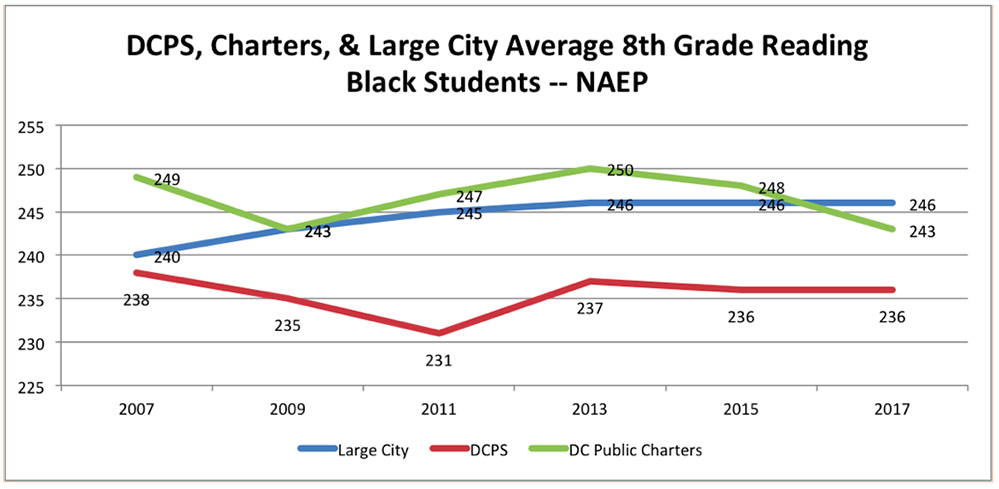
The final graph raises the question: What is happening with eighth-grade reading scores in D.C., particularly in charters?
Unfortunately, NAEP scores can’t tell us. Our best guess is that the mix of students changes after elementary school, because so many white families peel off for private schools. In 2017, whites made up 11 percent of fourth-graders who took the test but only 9 percent of eighth-graders.
Looking back 10 years, Washington, D.C, has made a lot of progress, though it still has a long way to go. Amid the central office scandals and the graduation inflation epidemic, growth on NAEP is something of which educators and students in our nation’s capital can be proud.
More important, D.C. has important lessons to teach other cities, if they’ll listen. First, they should embrace public charter schools, while limiting charter authorizing to one or two strong authorizers. Second, they should welcome the competitive effect on their traditional district, because experience suggests it is likely to wake up and change for the better. And as that happens, more and more middle-class families will stay in the city, creating a healthier, safer, more vibrant place.
Go Deeper: See all our coverage of eye-opening education research and analysis in our ‘Big Picture’ Series — and get the latest posts delivered straight to your inbox by signing up for The 74 Newsletter.
Help fund stories like this. Donate now!