An NCAA Bracket for Income Mobility: If the Tournament Were About Moving Up the Economic Ladder, These Schools Would Make the Sweet Sixteen

;)
Untangle Your Mind!
Sign up for our free newsletter and start your day with clear-headed reporting on the latest topics in education.
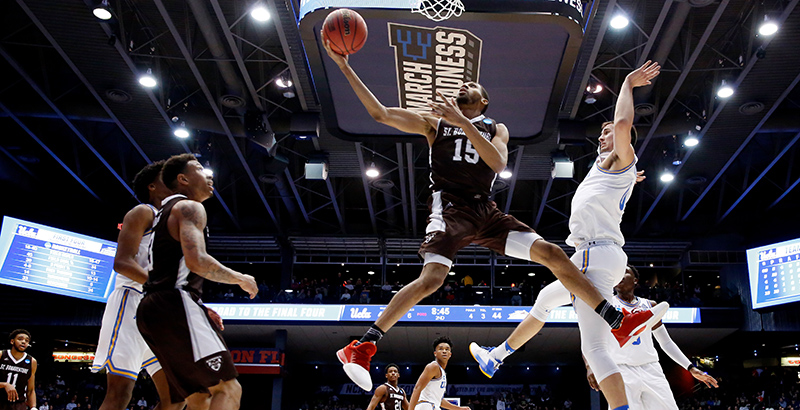
March Madness is with us once again, and once again we present a new bracket from a parallel universe. Unlike the typical NCAA Tournament bracket, experts don’t need to speculate about winners and losers, and there is no prize for predicting the winner. Our parallel bracket for the 2018 Income Mobility Tournament is based on data from the Equality of Opportunity Project housed at Stanford University. In contrast to the NCAA bracket, which maps the performance of the 68 teams vying for the Division I men’s basketball national championship, the mobility bracket plots how well each of the participating schools manages to move its students to the top quintile of the income distribution although their parents came from the bottom quintile.
In effect, the mobility bracket is about how well some schools make way for the American Dream of intergenerational mobility.
Last year we noted that the bragging rights that go to NCAA winners are often accompanied by a surge in applications to their schools — the so-called Flutie Effect. The assumption is that by hitching one’s wagon to champions, the radiance of the victors will light the path to personal and professional success. But now, as last year, the mobility bracket challenges that assumption by pointing out that winning on the basketball court does not necessarily translate into succeeding in life.
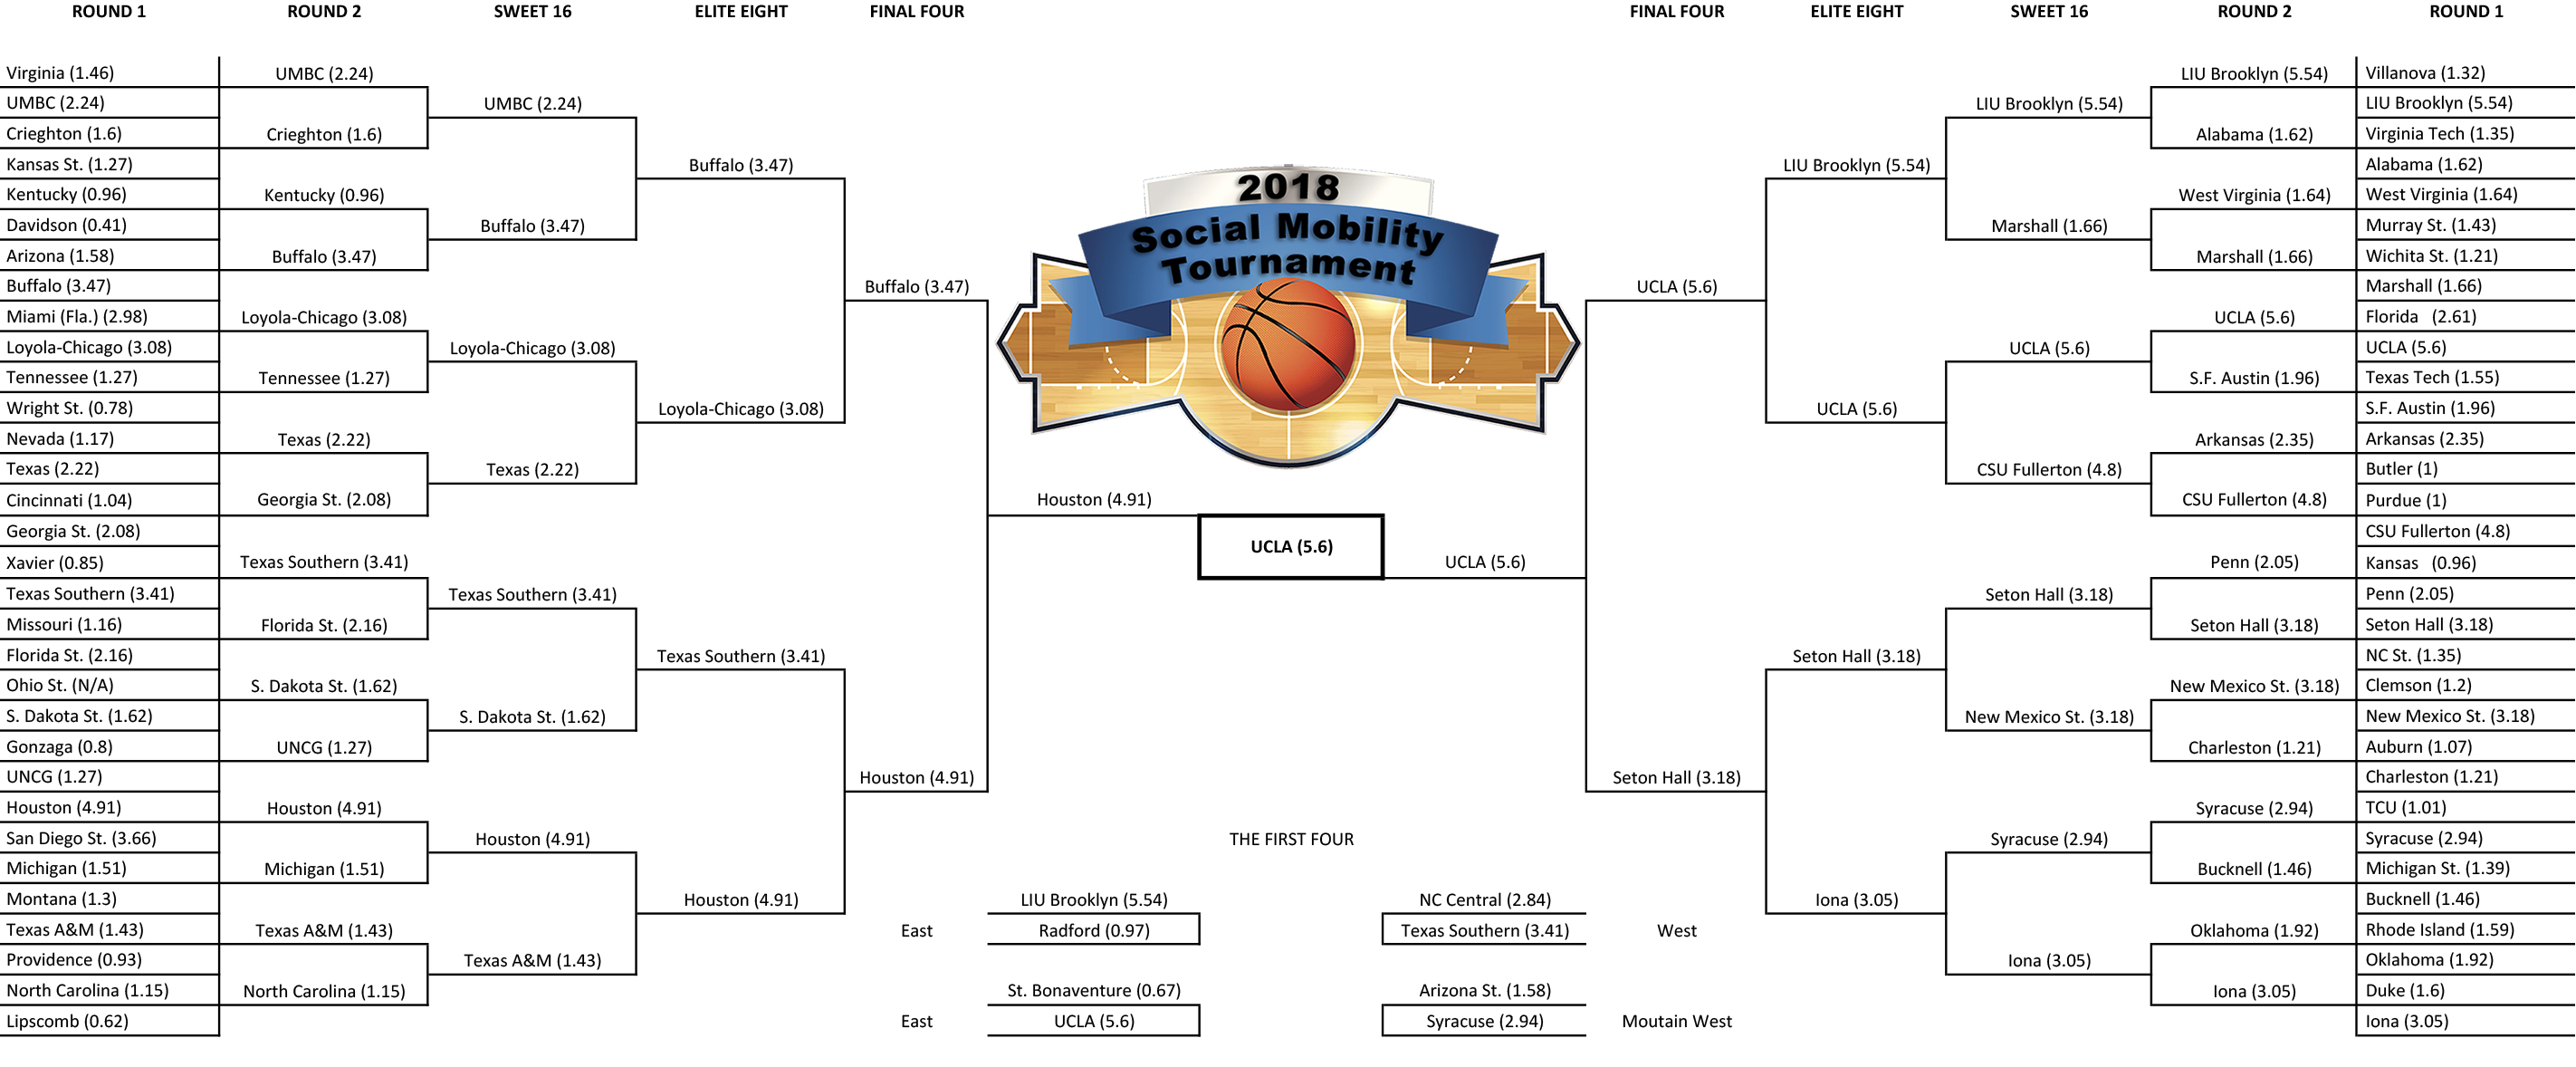
The mobility bracket pictured below ranks this year’s NCAA tournament schools by how well they manage to increase their students’ social mobility. The mobility scores noted represent the percentage of students, ages 19–22 in the early 2000s, who by 2014 had managed to reach the top quintile of the income distribution despite having parents who came from the bottom quintile.
To make sense of the results of the 2018 Income Mobility Tournament bracket, note that a score of 1 means 1 percent of such students at a given school were able to climb to the top 20 percent in earnings.
Basketball is about mobility, and as March Madness unfolds, the nation is treated to amazing feats of agility, coordination, and speed. The universities whose names are emblazoned on the players’ jerseys should likewise be expected to be nimble and sure across other parts of their mission. But are they?
All universities claim their students will be able to maneuver well the intricacies of their education and all assert that what their students are taught and learn will add up to a great job and a fulfilling career. But for those students whose parents are in the lowest quintile of income distribution, the likelihood that they will climb the ladder to financial success greatly depends on where they go to school. And how well that school performs on the court is no indication of how much its students will earn compared to their parents.
For example, UCLA, with a mobility score of 5.6, won the 2017 and 2018 mobility tournaments. But this year it was beaten on the court in the First Four by St. Bonaventure University, whose mobility score was a mere 0.67 — meaning fewer than 1 percent of its students move from the bottom to the top of the income ladder. In similar fashion, the Blackbirds of Long Island University–Brooklyn were knocked off in the First Four by the Highlanders of Radford University, although LIU Brooklyn’s students move from the bottom quintile to the top quintile at more than five times the rate of Radford students (5.54 versus 0.97). Indeed, only UCLA could beat LIU Brooklyn in the mobility tournament.
Next, consider the fate of the University of Southern California. The USC Trojans, widely expected to make the NCAA tournament with their respectable 23–11 season, were the team most egregiously snubbed by the NCAA selection committee. Yet, with a mobility score of 3.93, they would have reached the Final Four in the mobility bracket, outpacing both the Bulls of the State University of New York at Buffalo (3.47) and the Pirates of Seton Hall University (3.18) — edged out only by the tournament-winning Bruins and the Cougars of the University of Houston (4.91).
Whichever school takes home the NCAA tournament trophy will rightly celebrate its prowess on the court and will likely reap increased applications. In contrast, little to no acclaim will accrue to the schools that most help students climb the earnings ladder that permits them to make the American Dream theirs.
Each year, millions gamble on and watch the NCAA tournament. And the athletic programs — primarily in football and basketball — of the 48 largest universities annually bring home about $4.5 billion in revenue. Nearly 350 Division I college basketball teams make up the pool of tournament dreamers, with a total of about 4,500 basketball players. These players are drawn from among the approximately 6 million young men who made up the high school graduation classes during four years. This means a male high school graduate has around a 1 in 1,330 chance to play on a Division I basketball team. But less than 1 in 75 (or 1.3 percent) of NCAA senior players will ever be drafted by an NBA team. No doubt much is at stake for players and schools as they battle their way to the Final Four.
But much is likewise at stake for the nearly 2 million students who enroll in the thousands of two- or four-year colleges that together educate over 20 million students. Like the Division I players, most of these students are working to gain a firmer hold on the American Dream than their parents had. But for most of these students, their chances depend above all on their family’s income.
Therefore, the colleges and universities that educate the majority of Americans and have high mobility scores must buck a powerful tide. And in doing so successfully, they are far more deserving of recognition than even those great schools with winning basketball teams.
We end with a simple suggestion: Mobility scores matter, and schools that have high mobility scores should see them as a source of pride. After all, as we said last year, these are the sorts of results that should be boosting applications and driving interest from young adults who want to enjoy the long-term benefits of upward mobility.
March Madness is indeed a great escape, but social mobility is the great escape.
Jorge Klor de Alva is the president of the Nexus Research and Policy Center. He was previously a senior executive at Apollo Education Group, Inc., and a professor at Princeton University and the Class of 1940 Professor at the University of California at Berkeley.
Mark Schneider is a vice president and Institute Fellow at the American Institutes for Research and the president of College Measures. He previously served as the U.S. commissioner of education statistics from 2005 to 2008 and is a distinguished professor emeritus of political science at the State University of New York, Stony Brook.
Help fund stories like this. Donate now!
Jorge Klor de Alva is the president of the Nexus Research and Policy Center. He was previously a senior executive at Apollo Education Group, Inc., a professor at Princeton University, and the Class of 1940 Professor at the University of California, Berkeley.
contributors@the74million.org
Mark Schneider is director of the Institute of Education Sciences at the United States Department of Education. Before assuming that role, he was a vice president and Institute Fellow at the American Institutes for Research and the president of College Measures. He previously served as the U.S. commissioner of education statistics from 2005 to 2008 and is a distinguished professor emeritus of political science at the State University of New York, Stony Brook.
contributors@the74million.org